- Home
- About Journals
-
Information for Authors/ReviewersEditorial Policies
Publication Fee
Publication Cycle - Process Flowchart
Online Manuscript Submission and Tracking System
Publishing Ethics and Rectitude
Authorship
Author Benefits
Reviewer Guidelines
Guest Editor Guidelines
Peer Review Workflow
Quick Track Option
Copyediting Services
Bentham Open Membership
Bentham Open Advisory Board
Archiving Policies
Fabricating and Stating False Information
Post Publication Discussions and Corrections
Editorial Management
Advertise With Us
Funding Agencies
Rate List
Kudos
General FAQs
Special Fee Waivers and Discounts
- Contact
- Help
- About Us
- Search


The Open Fuels & Energy Science Journal
(Discontinued)
ISSN: 1876-973X ― Volume 11, 2018
Effect Analysis of Nitrogen Injection on the Variation of “Oxidation Zone” in Coal Mine Gob Based on Numerical Simulation
Jing Shen1, Mingran Chang2, *
Abstract
One of the main reasons for coal mine fire is spontaneous combustion of residual coal in gob. As the difference of compaction degree of coal and rock, the underground gob can be considered as a porous medium and divided into “three zones” in accordance with the criteria. The “three zones” are “heat dissipation zone”, “oxidation zone” and “choking zone”, respectively. Temperature programming experiments are taken and numerical simulation with obtained experimental data is utilized to analyze the distribution of “three zones” in this paper. Different width and depth of “oxidation zone” are obtained when the inlet air velocity is changed. As the nitrogen injection has inhibition effect on spontaneous combustion of residual coal in gob, nitrogen is injected into the gob. The widths of “oxidation zone” are compared before and after nitrogen injection. And ultimately the optimum location and volume of nitrogen injection are found out.
Article Information

Identifiers and Pagination:
Year: 2016Volume: 9
First Page: 47
Last Page: 54
Publisher Id: TOEFJ-9-47
DOI: 10.2174/1876973X01609010047
Article History:
Received Date: 15/10/2015Revision Received Date: 04/08/2016
Acceptance Date: 06/08/2016
Electronic publication date: 21/09/2016
Collection year: 2016
open-access license: This is an open access article licensed under the terms of the Creative Commons Attribution-Non-Commercial 4.0 International Public License (CC BY-NC 4.0) (https://creativecommons.org/licenses/by-nc/4.0/legalcode), which permits unrestricted, non-commercial use, distribution and reproduction in any medium, provided the work is properly cited.
* Address correspondence to this author at the Ding on the 11th, Xueyuan Rd, Haidian District, Beijing, 100083, China; Tel: 18810538369; E-mail: changmingran0216@163.com
| Open Peer Review Details | |||
|---|---|---|---|
| Manuscript submitted on 15-10-2015 |
Original Manuscript | Effect Analysis of Nitrogen Injection on the Variation of “Oxidation Zone” in Coal Mine Gob Based on Numerical Simulation | |
1. INTRODUCTION
Fire is one of the worst disasters in coal mines. According to statistics, 72.86% of coal mines exist coal spontaneous combustion phenomena, accounting for 90% of the total number of coal mine fires [1Jingcai, X. Decisiontheory of the Dangerous Zone of Coal Spontaneous Combustion; Coal Industry Press: Beijing, 2001, pp. 199-219., 2Haizhu, L.; Yuntao, L. Current status and prospects of coal spontaneous combustion forecast technology. China Safety Sci. J., 2003, 13(3), 76-78.], and coal spontaneous combustion leads to huge losses and safety hazards for coal resources in China. Coal oxidation and spontaneous combustion in gob are synthesis results of air leakage and heat accumulation caused by coal oxidation. Scholars studied the coal spontaneous combustion in underground coal mine and have already made some achievements [3Yuanping, C.; Zenghua, L. Process of oxygen adsorption by coal at low temperature and its heat effect. J. Chin. Univ. Min. Technol., 2009, 28(4), 310-313.-5Jianfang, Z.; Ning, H.; Dengji, L. The relationship between oxygen consumption rate and temperature during coal spontaneous combustion. Saf. Sci., 2012, 50, 842-845.
[http://dx.doi.org/10.1016/j.ssci.2011.08.023] ].With the development of computation technology, the study of coal spontaneous combustion with numerical simulation has become a trend [6Shengqiang, Y.; Quan, X.; Jin, H. The “three zones” microcirculation theory of Gob spontaneous combustion and a numerical simulation of air leakage flow field. J. Chin. Univ. Min. Technol., 2009, 38(6), 769-773., 7Xinhai, Z.; Guang, X.; Xiaokun, C.; Jun, D.; Hu, W. Determination of spontaneous combustion danger zones and prediction of spontaneous combustion during mining of near-distance Coal Seams. J. China Coal Soc., 2005, 30(6), 733-736.]. 1950s, nitrogen was began to be used for fire prevention and control in the word. Czech Republic, United Kingdom, Germany, France, the former Soviet Union, Bulgaria and other countries were the first countries that use nitrogen for mine fire prevention and control in the world. Nitrogen has stable physical properties, smaller density than air, good diffusivity, strong inerting effect and other unique advantages, making nitrogen technology for mine fire prevention and control more refined. In the late 1960s, nitrogen injection has become the technical measures to deal with various types of large-scale universal fire in the world. In the 1980s, nitrogen injection was used to prevent spontaneous combustion in high-risk areas of coal seam in China, while it was also widely used for mine fire control, unsealing and reducing fire region and other issues [8Qilin, H.; Deming, W. Numerical simulation of spontaneous combustion process in goaf areas by full-mechanized and caving roof coal. J. Chin. Univ. Min. Technol., 2004, 33(1), 11-14.-10Jones, J.C. A new and more reliable test for the propensity of coals and carbons to spontaneous heating. J. Loss Prevent. Proc., 2000, 13, 52-55.
[http://dx.doi.org/10.1016/S0950-4230(99)00055-8] ].
According to the theoretical analysis of coal spontaneous combustion process, the development of the process is the result of physical and chemical effects of coal oxidation. The physical adsorption, chemical adsorption and chemical reaction between coal and oxygen release heat. If the heat can be accumulated, it will cause the heat-up of coal, and eventually lead to spontaneous combustion of coal. In summing up the results of a large number of production practice, scholars have concluded three basic conditions of coal spontaneous combustion [11Hu, W.; Jingcai, X.; Hanling, X.; Aiping, D. Analysis of effect factors on oxidation exothermic of coal spontaneous combustion. Coal Conver., 2001, 5, 10-11.-13Yuexi, D. Research and implementation of new nitrogen injection process. Shandong Coal Sci. Technol., 2000, (S1), 142-145.]: (1) the coal is piled of fragmentation state with spontaneous combustion tendency; (2) ventilation with oxygen sustains the development of coal oxidation process; (3) heat which is generated by coal oxidation process is able to be accumulated. Based on the three conditions, the mined-out area can be divided into “three zones” for analysis of spontaneous combustion [14Vorres, K.S.; Wertz, D.L.; Malhotra, V. Drying of Beulah-Zaplignite. Fuel, 1992, 71, 1047-1053.
[http://dx.doi.org/10.1016/0016-2361(92)90113-3] , 15Schmal, D. Spontaneous heating of stored coal. Chem. Coal Weathering, 1989, 2, 133-215.], which are “heat dissipation zone”, “oxidation zone” and “choking zone”, respectively. The classification criteria of “three zones” in gob is shown in the following Table 1 [16Krishnaswamy, S.; Agarwal, P.K.; Gunn, R.D. Low-temperature oxidation of coal-modeling spontaneous combustion in coal stockpiles. Fuel, 1996, 75, 353-362.
[http://dx.doi.org/10.1016/0016-2361(95)00249-9] , 17Minggao, Y.; Yanmin, Z.; Chang, L. Thermal analysis of kinetics of coal oxidation. Proc. Earth Planet. Sci., 2009, 1, 341-346.
[http://dx.doi.org/10.1016/j.proeps.2009.09.054] ]. In this paper, oxygen concentration field is taken as an example for analysis and research.

2. EXPERIMENTS
The occurrence and development of coal spontaneous combustion are extremely complex and dynamic physical chemical processes, which are spontaneous generation of coal oxidation reaction, gradual heat accumulation and final combustion occurrence. At lower temperatures, when coal reacts with oxygen, physical adsorption mainly happens and then it converts to chemical adsorption if the physical adsorption reaches equilibrium. With the temperature increasing, the speed of chemical adsorption gets bigger and chemical reaction happens further. In this paper, temperature programming experiment is taken to examine the oxygen consumption when coal reacts with oxygen at different temperatures. And it has important guiding significance for analysis coal spontaneous combustion characteristics and prediction of coal seam spontaneous combustion. The testing apparatus is shown in Fig. (1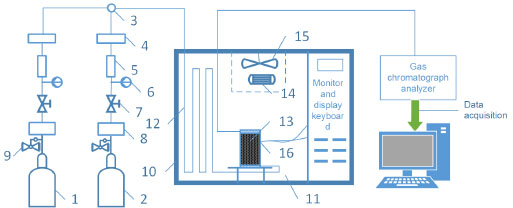 ). The diameter of coal sample tank is 9.5 cm, and the height is 25 cm. Coal sample tank contains coal which weighs about 250 g. About 2 cm free space (100 steel mesh boosting the coal) are left at the top and bottom of coal sample tank. Then the tank with coal sample is placed in temperature programming box for being heated up at a certain heating rate, and the quantitative preheated air is introduced at the same time. Finally the temperature of coal and gas composition are monitored and analyzed. The air is supplied from WM-6 oil-free air compressor, through the three-way flow control valve and rotameter into the temperature control box for preheating. After preheating, the air flows into the sample tank through the coal sample, and then flows into the gas chromatography analyzer for gas analysis after being dried in the exhaust pipe. Every 15°C, the gas components are extracted and measured from the coal sample meanwhile time and temperature are recorded. The temperature range of the experiment is from 35 to 215 °C. The air flow rate is controlled at 60 ml min-1. The generated gas are collected at the outlet and gas chromatographic analyzer is utilized to analyze composition and content of the collected gas. The data is recorded at last.
 |
Fig. (1) Structure of the experimental apparatus. |
After data processing and calculation, the curve of coal oxygen consumption rate versus temperature (the line with black points) is shown in Fig. (2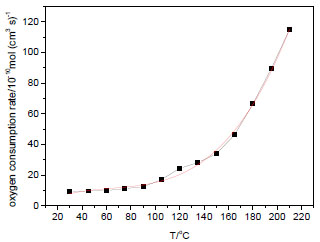 ). Through fitting, coal oxygen consumption rate versus temperature basically obeys the function:
y=-0.91564+0.44179x-5.85e-3x2+3.035e-5x3
Where y is oxygen consumption rate and x is temperature. The correlation coefficient is 0.9962, which is a high degree of fitting.
 |
Fig. (2) Oxygen consumption rate versus temperature. |
3. ESTABLISHMENT Of NUMERICAl MODEL AND BOUNDARY CONDITIONS
3.1. Governing Equations
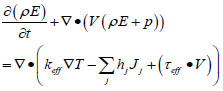
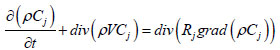
Velocity field, concentration field and temperature field in gob obey fluid flow physical conservation law which includes three basic conservations (mass, energy and momentum). CO, CO2 and other gases will be generated by coal oxidation when air flows in underground tunnel, that’s why the concentration field also abides the fraction conservation [18Chen, J.S.; Wang, Y.; Jiang, Z.G. Numerical simulation of blasting dust concentration distribution and diffusion regularities in stope. J. China Coal Soc., 2013, 38(Suppl. 1), 147-152.]. Airflow is in a state of turbulent in coal mine gob, and the fluid flow can be considered as incompressible and unsteady, and so the turbulent transport equation should be attached at the same time. Conservation equations for mass, energy, momentum and species can be expressed as:
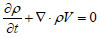 |
(1) |
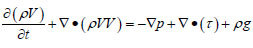 |
(2) |
 |
(3) |
 |
(4) |
Where ρ is the fluid density, kg m-3; t is time, s; V is the fluid velocity, m s-1; p is pressure, Pa; ρ is the viscous stress tensor, N m-2; g is gravity acceleration, m s-2; T is temperature, K; E is total energy including internal energy and kinetic energy, J; keff is the effective fluid thermal conductivity; hj, Jj are enthalpy and diffusion flux of component j, respectively; Cj is volume concentration of component j; Rj is diffusion coefficient of component j, m2 s-1.
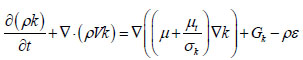
K-epsilon model is the most widely used model in engineering field, and it is chosen in this paper as it gives reasonable good prediction between simulation results and experimental data [19Versteeg, H.K. Malalasekera. An Introduction to Computational Fluid Dynamics-the Finite Volume Method; Longman Scientific and Technical, 1995. , 20Parra, M.T.; Villafruela, J.M.; Castro, F.; Mendez, C. Numerical and experimental analysis of different ventilation system in deep mines. Build. Environ., 2006, 41, 87-93.
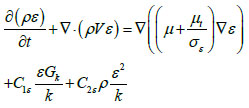
[http://dx.doi.org/10.1016/j.buildenv.2005.01.002] ]. In short, k-epsilon model considers two-equation model which solves for turbulent kinetic energy, k, and its rate of dissipation,ε, which is coupled with turbulent viscosity. This model is given as:
 |
(5) |
 |
(6) |
Where Gk is the generation of turbulence kinetic energy due to mean velocity gradients; C1ε,C2ε are constants, 1.44 and 1.92 respectively; σk, σε are turbulent Prandtl numbers for k and ε, respectively; µt is turbulent viscosity expressed as:
 |
(7) |
The values of Cµ, σk and σε are 0.09, 1 and 1.3, respectively.
3.2. Geometric Models
According to the actual situation of mine gob, reasonably predigesting is made in this paper. A two-dimensional model is developed for a typical mine gob region, shown in Fig. (3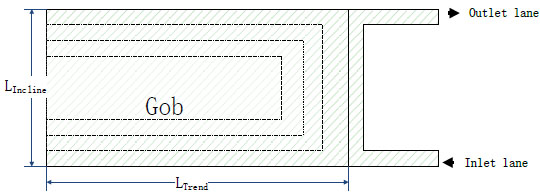 ). Details on the geometrical parameters are: length of gob trend is 100 m, length of gob incline is 60 m. The working face is ventilated by “one source one sink” ventilation. The inlet and outlet lane are both 3 m wide. Due to the pressure of the coal mine and the supporting role of coal wall near the inlet and outlet lanes, the distribution of porosity in gob decreases gradually along the trend and increases gradually along the incline. On the basis of mine pressure displacement data, the gob can be divided into four regions as shown in Fig. (3). The range of broken expansion coefficient is 1.25~1.58. Compared with the gob, the area of nitrogen injection is very small, thus it can be set as a nitrogen generating point source in gob to achieve the simulation of nitrogen injection. The base case and geometrical are listed in Table 2.
 |
Fig. (3) Geometric model of gob. |

3.3. Boundary Conditions
The boundary conditions for the model are summarized as follows: (1) at walls: the standard wall is used in all simulations with no slip; (2) inlet: air velocity is 0.6, 0.8, 1, 1.2, 1.4 and 1.6 m s-1 at the start with the relative intensity of turbulence; (3) at the outlet: the pressure is set to standard atmospheric pressure(101.325 kPa) with zero velocity gradient.
4. RESULTS AND DISCUSSION
4.1. “Oxidation Zone” Distribution in Gob before Nitrogen Injection
Due to the different degree compaction of coal and rocks at different positions in coal mine, the gob can be considered as a large porous media. Porous medium porosity n is determined by hulking coefficient Kp, that is
 , where the Kp is obtained by mine pressure monitoring. The air permeability K in gob can be expressed as
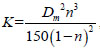 , where Dm is the average particle size of the porous medium. The Dm in this paper is 0.0012~0.007 m. According to experimental results, the oxygen consumption rate and heat release rate of coal oxidation are programmed and utilized in software FLUENT for calculation. When air velocity of inlet lane is 0.6~1.6 m s-1, oxygen concentration field is shown in Fig. (4
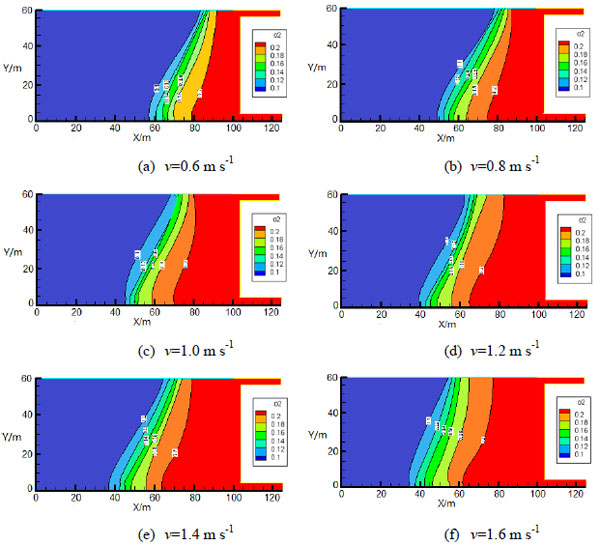 ). Without nitrogen injection, variations of width and depth of “oxidation zone” in gob along with changing of inlet velocity are shown in Figs. (5
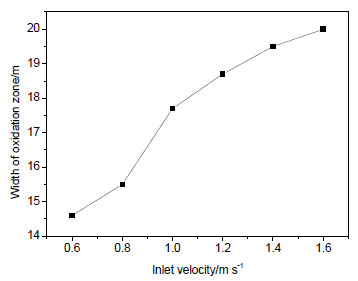 and 6
and 6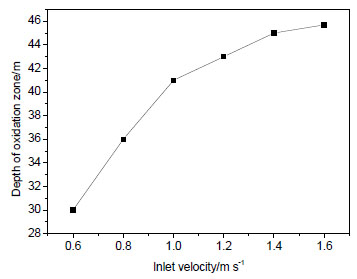 ), respectively.
 |
Fig. (4) Oxygen concentration distribution contours of gob. |
 |
Fig. (5) Width of “oxidation zone” in gob versus inlet velocity. |
 |
Fig. (6) Depth of “oxidation zone” in gob versus inlet velocity. |
From the simulation results, it can be obtained that: before nitrogen injection, the oxygen concentration of air inlet side is higher than air outlet side and the oxygen of inlet side has a large range of activities; oxygen concentration decreases along with the increasing distance from the working face. According to oxygen concentration criteria for division “three zones” in gob of coal mine, in Figs. (5 and 6), it can be seen that with the increasing air inlet velocity, the width of “oxidation zone” increases gradually and the “oxidation zone” extends into the gob. When the inlet velocity is 0.6~1.6 m s-1, the width of “oxidation zone” is between 15 m and 20 m and the depth of “oxidation zone” is about 30~45 m.
4.2. “Oxidation Zone” Distribution in Gob after Nitrogen Injection
In order to select the optimum location and volume of nitrogen injection, nitrogen is injected into the gob. The injection holes are 30 m, 35 m, 40 m, 45 m, 50 m, and 55 m from the working face, respectively. The diameter of the holes is 0.2 m. Nitrogen injection rate is 5 m3 s-1. Inlet velocity is 1 m s-1. For a summary and saving space, the results here are not shown one by one. Along with the depth of injection holes increases from the working face, the width of “oxidation zone” changes as follow Figures. In Fig. (7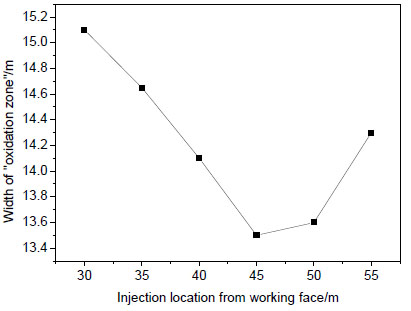 ), with the distance of injection holes increases from working face, width of “oxidation zone” decreases first and then increases. When the location is at 45~50 m, the width of “oxidation zone” is minimum. That is the optimum location of nitrogen injection, 45~50 m away from the working face. Then 45 m away from the working face is selected as the optimum location of nitrogen injection. When the volume of nitrogen injected into the gob per minute changes, the width of “oxidation zone” changes as well, seen in Fig. (8
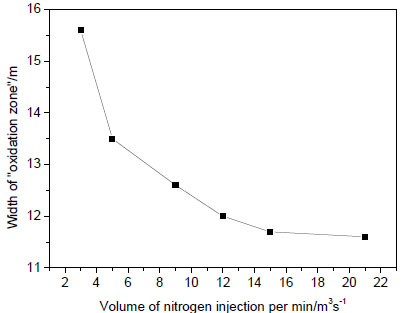 ). When nitrogen injection location is 45 m away from the working face, the width of “oxidation zone” decreases gradually with the nitrogen injection rate increases, but the decreasing trend is getting smaller. So in order to save resources, it is not good to simply increase the volume of nitrogen injected into the gob, as injection reaching an quantity, the effects are almost the same.
 |
Fig. (7) Variation of “oxidation zone” width verse injection location. |
 |
Fig. (8) Width of “oxidation zone” verse nitrogen injection rates. |
CONCLUSION
Spontaneous combustion of residual coal in gob is a great threat to the underground production and staff, and the spontaneous combustion of coal generally occurs in the “oxidation zone” of the gob. In this paper, the effect of nitrogen injection on the “oxidation zone” of the gob is simulated by numerical simulation. By comparing the change of the width and position of the “oxidation zone” before and after the injection, the optimum nitrogen injection rate and location of the nitrogen were found out. It provides the basis for the injection of nitrogen for fire prevention and extinguishment in the gob.
Oxygen concentration distribution is simulated with and without nitrogen injection, respectively. Comparative results show that under nitrogen injection conditions, the “oxidation zone” is mainly 30-45 m away from the working face. Nitrogen injection destroies air flow field and diluts the oxygen concentration in gob. The inerting effect is very obvious.
At the optimum nitrogen injection position, the width of “oxidation zone” decreases with the increasing volume of nitrogen injection. But the decreasing trend is flatten. Thus indicates that only raising the volume of nitrogen injection for inerting effect is limited.
CONFLICT OF INTEREST
The authors confirm that this article content has no conflict of interest.
ACKNOWLEDGEMENTS
Declared none.
REFERENCES
| [1] | Jingcai, X. Decisiontheory of the Dangerous Zone of Coal Spontaneous Combustion; Coal Industry Press: Beijing, 2001, pp. 199-219. |
| [2] | Haizhu, L.; Yuntao, L. Current status and prospects of coal spontaneous combustion forecast technology. China Safety Sci. J., 2003, 13(3), 76-78. |
| [3] | Yuanping, C.; Zenghua, L. Process of oxygen adsorption by coal at low temperature and its heat effect. J. Chin. Univ. Min. Technol., 2009, 28(4), 310-313. |
| [4] | Deming, W. Mine Fires; China University of Mining and Technology Press: Xuzhou, 2008, pp. 125-136. |
| [5] | Jianfang, Z.; Ning, H.; Dengji, L. The relationship between oxygen consumption rate and temperature during coal spontaneous combustion. Saf. Sci., 2012, 50, 842-845. [http://dx.doi.org/10.1016/j.ssci.2011.08.023] |
| [6] | Shengqiang, Y.; Quan, X.; Jin, H. The “three zones” microcirculation theory of Gob spontaneous combustion and a numerical simulation of air leakage flow field. J. Chin. Univ. Min. Technol., 2009, 38(6), 769-773. |
| [7] | Xinhai, Z.; Guang, X.; Xiaokun, C.; Jun, D.; Hu, W. Determination of spontaneous combustion danger zones and prediction of spontaneous combustion during mining of near-distance Coal Seams. J. China Coal Soc., 2005, 30(6), 733-736. |
| [8] | Qilin, H.; Deming, W. Numerical simulation of spontaneous combustion process in goaf areas by full-mechanized and caving roof coal. J. Chin. Univ. Min. Technol., 2004, 33(1), 11-14. |
| [9] | Minggao, Y.; Zhicong, H.; Chaoping, Y. Mathematic model for calculating the shortest coal spontaneous combustion time. J. China Coal Soc., 2001, 26(5), 516-519. |
| [10] | Jones, J.C. A new and more reliable test for the propensity of coals and carbons to spontaneous heating. J. Loss Prevent. Proc., 2000, 13, 52-55. [http://dx.doi.org/10.1016/S0950-4230(99)00055-8] |
| [11] | Hu, W.; Jingcai, X.; Hanling, X.; Aiping, D. Analysis of effect factors on oxidation exothermic of coal spontaneous combustion. Coal Conver., 2001, 5, 10-11. |
| [12] | Congchuan, W.; Aiyou, W.; Kangxu, C. Coupling of oxygen consumption rate and temperature during coal spontaneous combustion. J. Coal Sci. Technol., 2006, 34(4), 65-67. |
| [13] | Yuexi, D. Research and implementation of new nitrogen injection process. Shandong Coal Sci. Technol., 2000, (S1), 142-145. |
| [14] | Vorres, K.S.; Wertz, D.L.; Malhotra, V. Drying of Beulah-Zaplignite. Fuel, 1992, 71, 1047-1053. [http://dx.doi.org/10.1016/0016-2361(92)90113-3] |
| [15] | Schmal, D. Spontaneous heating of stored coal. Chem. Coal Weathering, 1989, 2, 133-215. |
| [16] | Krishnaswamy, S.; Agarwal, P.K.; Gunn, R.D. Low-temperature oxidation of coal-modeling spontaneous combustion in coal stockpiles. Fuel, 1996, 75, 353-362. [http://dx.doi.org/10.1016/0016-2361(95)00249-9] |
| [17] | Minggao, Y.; Yanmin, Z.; Chang, L. Thermal analysis of kinetics of coal oxidation. Proc. Earth Planet. Sci., 2009, 1, 341-346. [http://dx.doi.org/10.1016/j.proeps.2009.09.054] |
| [18] | Chen, J.S.; Wang, Y.; Jiang, Z.G. Numerical simulation of blasting dust concentration distribution and diffusion regularities in stope. J. China Coal Soc., 2013, 38(Suppl. 1), 147-152. |
| [19] | Versteeg, H.K. Malalasekera. An Introduction to Computational Fluid Dynamics-the Finite Volume Method; Longman Scientific and Technical, 1995. |
| [20] | Parra, M.T.; Villafruela, J.M.; Castro, F.; Mendez, C. Numerical and experimental analysis of different ventilation system in deep mines. Build. Environ., 2006, 41, 87-93. [http://dx.doi.org/10.1016/j.buildenv.2005.01.002] |