- Home
- About Journals
-
Information for Authors/ReviewersEditorial Policies
Publication Fee
Publication Cycle - Process Flowchart
Online Manuscript Submission and Tracking System
Publishing Ethics and Rectitude
Authorship
Author Benefits
Reviewer Guidelines
Guest Editor Guidelines
Peer Review Workflow
Quick Track Option
Copyediting Services
Bentham Open Membership
Bentham Open Advisory Board
Archiving Policies
Fabricating and Stating False Information
Post Publication Discussions and Corrections
Editorial Management
Advertise With Us
Funding Agencies
Rate List
Kudos
General FAQs
Special Fee Waivers and Discounts
- Contact
- Help
- About Us
- Search


The Open Medical Informatics Journal
(Discontinued)
ISSN: 1874-4311 ― Volume 13, 2019
Classification of Event-Related Potentials Associated with Response Errors in Actors and Observers Based on Autoregressive Modeling
Christos E Vasios1, Errikos M Ventouras*, 2, George K Matsopoulos1, Irene Karanasiou1, Pantelis Asvestas2, Nikolaos K Uzunoglu1, Hein T Van Schie3, Ellen R.A de Bruijn3
Abstract
Event-Related Potentials (ERPs) provide non-invasive measurements of the electrical activity on the scalp related to the processing of stimuli and preparation of responses by the brain. In this paper an ERP-signal classification method is proposed for discriminating between ERPs of correct and incorrect responses of actors and of observers seeing an actor making such responses. The classification method targeted signals containing error-related negativity (ERN) and error positivity (Pe) components, which are typically associated with error processing in the human brain. Feature extraction consisted of Multivariate Autoregressive modeling combined with the Simulated Annealing technique. The resulting information was subsequently classified by means of an Artificial Neural Network (ANN) using back-propagation algorithm under the “leave-one-out cross-validation” scenario and the Fuzzy C-Means (FCM) algorithm. The ANN consisted of a multi-layer perceptron (MLP). The approach yielded classification rates of up to 85%, both for the actors’ correct and incorrect responses and the corresponding ERPs of the observers. The electrodes needed for such classifications were situated mainly at central and frontal areas. Results provide indications that the classification of the ERN is achievable. Furthermore, the availability of the Pe signals, in addition to the ERN, improves the classification, and this is more pronounced for observers’ signals. The proposed ERP-signal classification method provides a promising tool to study error detection and observational-learning mechanisms in performance monitoring and joint-action research, in both healthy and patient populations.
Article Information
Identifiers and Pagination:
Year: 2009Volume: 3
First Page: 32
Last Page: 43
Publisher Id: TOMINFOJ-3-32
DOI: 10.2174/1874431100903010032
Article History:
Received Date: 4/12/2008Revision Received Date: 12/1/2009
Acceptance Date: 18/2/2009
Electronic publication date: 15/5/2009
Collection year: 2009
open-access license: This is an open access article licensed under the terms of the Creative Commons Attribution Non-Commercial License (http://creativecommons.org/licenses/by-nc/3.0/) which permits unrestricted, non-commercial use, distribution and reproduction in any medium, provided the work is properly cited.
* Address correspondence to this author at the Department of Medical Instrumentation Technology, Technological Educational Institution of Athens, Ag. Spyridonos Str., Egaleo, Athens, 12210, Greece; Tel: ++302105385387; Fax: ++302105385302; E-mails: ericvent@teiath.gr, ericvent@gmail.com
| Open Peer Review Details | |||
|---|---|---|---|
| Manuscript submitted on 4-12-2008 |
Original Manuscript | Classification of Event-Related Potentials Associated with Response Errors in Actors and Observers Based on Autoregressive Modeling | |
1. INTRODUCTION
Event-Related Potentials (ERPs) are a class of electroencephalographic (EEG) recordings, usually measured on the scalp, when a subject is presented with stimuli (or events). Strictly defined experimental protocols guide the administration of specific stimuli, according to psychological paradigms or tests. ERP study is focused on parts of the electrical potential waveform containing significant local maxima and minima, called components or peaks of the ERP. The high temporal resolution of ERPs allows for non-invasive observation of electrical activity changes in the brain, as reflected in scalp recordings, during the processing of information related to the presentation of the stimuli, therefore permitting the concurrent study of psychological measures of cognitive operations and of electrophysiological measures of brain functioning [1Johnson R Jr, Ed. Event-Related Brain Potentials and Cognition, Handbook of Neuropsychology. Amsterdam, The Netherlands: Elsevier 1995; 10. (Sec. 14), 2Fabiani M, Gratton G, Coles M. Event-related potentials: Methods, theory, and applications In: Cacioppo J, Tassinary L, Bernston G, Eds. Handbook of psychophysiology. New York, NY: Cambridge University Press 2000; pp. 53-84.]. When subjects commit incorrect actions, a negative deflection of the ERPs is produced, peaking at around 80 msec after the initiation of the incorrect response, called error-related negativity (ERN) [3Falkenstein M, Hohnsbein J, Hoormann J, Blanke L. Effects of errors in choice reaction tasks on the ERP under focused and divided attention In: Brunia CHM, Gaillard AWK, Kok A, Eds. Psychophysiological Brain Research. Tilburg, The Netherlands: Tilburg University Press 1990; pp. 192-5., 4Gehring WJ, Goss B, Coles MGH, Meyer DE, Donchin E. A neural system for error detection and compensation Psychol Sci 1993; 4: 385-90.]. A positivity following the ERN, the so-called error positivity (Pe) has also been described [5Falkenstein M, Hohnsbein J, Hoormann J, Blanke L. Effects of cross-modal divided attention on late ERP components: II. Error processing in choice reaction tasks Electroencephalogr Clin Neurophysiol 1991; 78: 447-55.], showing a maximum between 200 and 500 msec after the initiation of the incorrect response. Research has shown that ERN is elicited when there is a mismatch between representations of the actual response and the correct response [6Coles MGH, Scheffers MK, Holroyd CB. Why is there an ERN/Ne on correct trials? Response representations, stimulus-related components and the theory of error-processing Biol Psychol 2001; 56: 173-89., 7Falkenstein M, Hoormann J, Christ S, Hohnsbein J. ERP components on reaction errors and their functional significance: A tutorial Biol Psychol 2000; 51: 87-107.]. Pe have been linked to error awareness [8Nieuwenhuis S, Ridderinkof KR, Bloom J, Band GPH, Kok A. Error-related brain potentials are differentially related to awareness of response errors: evidence from an antisaccade task Psychophysiology 2001; 38: 752-60., 9Mathewson KJ, Dywan J, Segalowitz SJ. Brain bases of error-related ERPs as influenced by age and task Biol Psychol 2005; 70: 88-104.]. It therefore seems likely that ERN and Pe are related to mechanisms reflecting error detection, a key component of performance monitoring [10Taylor SF, Stern ER, Gehring WJ. Neural systems for error monitoring: recent findings and theoretical perspectives Neuroscientist 2007; 13: 160-72.]. Recently, the focus of ERN-research has been extended to include also the mechanisms related to the observation of errors committed by others, in an effort to elucidate whether the mechanisms responsible for learning ‘by doing’ are similar to mechanisms of observational learning [11van Schie H, Mars RB, Coles MGH, Bekkering H. Modulation of activity in medial frontal and motor cortices during error observation Nat Neurosci 2004; 7: 549-.]. In that work, an ERN was also found in a condition where subjects observed the incorrect actions of another person, albeit with a lower amplitude than the ERN for self-generated errors and a later occurrence of the peak.
Classification algorithms to discriminate between ERPs have been developed for various technical [12Sveinsson JR, Benediktsson JA, Stefansson SB, Davidsson K. Parallel principal component neural networks for classification of event-related potential waveforms Med Eng Phys 1997; 19: 15-20.-15Wang Y, Zhang Z, Li Y, Gao X, Gao S, Yang F. BCI competition 2003—data set IV: an algorithm based on CSSD and FDA for classifying single-trial EEG IEEE Trans Biomed Eng 2004; 51: 1081-6.] and clinical applications [6Coles MGH, Scheffers MK, Holroyd CB. Why is there an ERN/Ne on correct trials? Response representations, stimulus-related components and the theory of error-processing Biol Psychol 2001; 56: 173-89.]. Scalar autoregressive coefficients, extracted from biosignals and treated as feature vectors in classification methods, have been widely used for designing classifiers in biomedical systems. Tsoi et al. in [16Tsoi AC, So DSC, Sergejew A. Classification of electroenchephalogram using artificial neural networks In: Cowan JD, Tesauro G, Alspector J, Eds. Advances in Neural Information Processing Systems. San Francisco, CA: Morgan Kaufmann 1994; 6: pp. 1151-8.] used one channel of EEG to estimate a feature vector consisting of the autoregressive (AR) model coefficients. By inputting the features to a multilayer neural network, differentiation between normal subjects and subjects diagnosed as suffering from severe obsessive-compulsive disorder (OCD) and from severe schizophrenia was achieved. Roberts and Tarassenko in [17Roberts S, Tarassenko L. EEG analysis using self-organization In: In Proc 2nd Int Conf Artif Neural Netw; London UK. 1991; pp. 210-3.] investigated the different human sleep states using AR model coefficients extracted from a single-channel EEGs. Vasios et al. used AR model features of ERPs as input to a neural network for the classification of patients suffering from first-episode schizophrenia against control subjects [18Vasios C, Papageorgiou C, Matsopoulos GK, Nikita KS, Uzunoglu N. A decision support system of evoked potentials for the classification of patients with first-episode schizophrenia German J Psychiatry 2002; 5: 78-84.]. Almost all model-orders between 3 and 10, according to the Schwartz order-selection criterion, resulted in classification results up to 100% for electrode (C4-T6)/2.
When information can be extracted from multiple, simultaneously recorded waveforms, the AR model can be replaced by the Multivariate Autoregressive (MVAR) model. In the MVAR model, features are extracted from a number of input signals by using the multivariate analogue of the AR model. Mental task discrimination has been investigated using scalar and MVAR models of the EEG [19Anderson CW, Stolz EA, Shamsunder S. Multivariate autoregressive models for classification of spontaneous electroenchephalogram during mental tasks IEEE Trans Biomed Eng 1998; 45: 277-86.]. Order 3 was found to be the optimum using the Akaike information criterion. The features were inputted to a feed-forward neural network, resulting in a classification accuracy of 91.4%. In another multi-channel study, an MVAR model was computed to investigate the synchronization of brain structures, the degree of coupling between channels, the estimation of phase delays and eventually the direction of brain activity spreading [20Franaszczuk PJ, Blinowska KJ, Kowalczyk M. The application of parametric multi-channel spectral estimates in the study of electrical brain activity Biol Cybern 1985; 51: 239-47.]. An order of 6 was found to be adequate to parameterize four-channel data. Application of the MVAR model to the current study requires the construction of an associated feature vector and the definition of several parameters such as the number and kind of electrodes and the order of the model used. Exhaustive search for the selection of the values of these parameters is not feasible, especially in multi-channel studies recording tens of electrodes. Therefore, methods to reduce the computational load should be used. An example was proposed in [21Vasios CE, Matsopoulos GK, Ventouras EM, et al. Multivariate autoregressive modeling combined with simulated annealing optimization for classifying sources of event related potentials Int J Bioelectromagnetism 2005; 7: 78-81.], where the MVAR model was combined with a global optimization method, the Simulated Annealing (SA) technique to detect optimum combinations (number and kind) of electrodes and model order. The Fuzzy C-Means (FCM) algorithm was used as well as classification with a Multi-layer Perceptron (MLP) Artificial Neural Network (ANN).
The primary aim of the present study was the development and implementation of a classification system for discriminating correct and incorrect responses, as well as observations of correct and incorrect responses, based on scalp-recorded ERPs of actors and observers, using features extracted through the MVAR model in combination with the SA technique. The present work is based on subjects’ averages and is a first step towards future single-trial classification. We aimed at investigating the discrimination ability of signals including only the ERN, both for the execution and the observation condition, and signals including both the ERN and the Pe. The study also aimed at investigating and comparing the performance of two classifiers, one based on a MLP ANN classifier and the other on the FCM method.
2. SYSTEM DESIGN
2.1. The Proposed Classification System
In this study, two similar classification systems were developed: one classification system for discriminating correct (Class 1) and incorrect (Class 2) responses and a second classification system, with the same structure, for discriminating the observation of correct responses (Class 1) and the observation of incorrect responses (Class 2). Classification systems each consisted of two modules: the feature-extraction module and the classification module, as shown in Fig. (1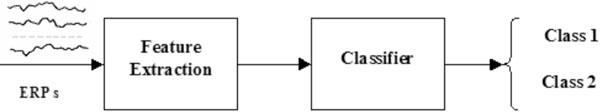 ).
).

The inputs to the first module were each subject’s averaged ERPs waveforms, as computed by the procedure described in [11van Schie H, Mars RB, Coles MGH, Bekkering H. Modulation of activity in medial frontal and motor cortices during error observation Nat Neurosci 2004; 7: 549-.]. The appropriate features were extracted and processed by the feature-extraction module, and then fed to the classification module. The output of the system encodes two classes (Class 1 and Class 2). In case the system is applied for classifying actions, Class 1 corresponds to correct actions and Class 2 corresponds to erroneous actions. In case the system is applied for classifying observations, Class 1 corresponds to observations of correct actions and Class 2 to observations of erroneous actions.
2.2. Feature-Extraction Module
In the present work, the MVAR model was used for feature extraction. When using the MVAR model for ERP classification and the construction of the feature vector, a number of parameters have to be selected such as the number and the kind of signals (i.e. ERPs recorded at specific electrodes whose waveforms will be modeled), the time interval of the waveforms to be modeled, and the order of the model to be used. An exhaustive search for the selection of the parameters that achieve the best classification rate is practically very difficult as the search space for all parameter combinations is very large. A further disadvantage of the MVAR model is the dependence of the model coefficients on the input signals, where any modification of the input signals requires recalculation of the MVAR coefficients.
For these reasons, the method for the extraction of MVAR coefficients from ERPs in the present study was combined with a global optimization method, the SA technique [22Kirkpatrick SG, Gelatt CD, Vecchi MP. Optimization by simulated annealing Science 1983; 220: 671-9.], to detect optimal combinations of ERP recordings, in terms of number and kind, time interval and model order, leading to the best classification performance.
The implementation of the MVAR model to ERPs is based on the principle that the signals are described by a linear filter fed with noise. According to this model, each value of the signal can be estimated using the values of the preceding p samples, as follows [23Priestley MB. Spectral Analysis and Time Series In: Burlington, MA: Academic Press 1981., 24Kay SM. Modern Spectral Estimation: Theory and Application In: Englewood Cliffs, NJ: Prentice-Hall 1987.]:
where N is the maximum number of samples available. The procedure works for samples with the index (p, p+1, ...), i.e. starting after the p minimum number of initialization inputs. In Equation (1), x(k) is a d-dimensional vector of data at sample with index k and e(k) is a d-dimensional vector of random input (noise). Furthermore, A(i), i=1,…,p are the dxd matrices of the AR coefficients to be estimated from x(k), k=1,…,N and p is the model order. These coefficients construct the feature vector of each subject.
According to the proposed feature-extraction methodology, an optimum combination of ERP recordings, in terms of number and kind, is obtained by implementing the MVAR model in conjunction with the SA technique. The SA technique provides the advantage of finding a possible global minimum (or maximum) in contrast with other local optimization methods, which require a good initial guess and are often trapped to local minima (or maxima) [25Ingber L. Simulated Annealing: Practice Versus Theory Math Comput Model 1993; 18: 29-57., 26Press WH, Teukolsky SA, Vetterling WT, Flannery BP. Numerical Recipes in C: the Art of Scientific Computing. Cambridge, UK: Cambridge University Press 1992.]. This optimum selection is tested for different model orders, within a pre-defined interval, based on the performance of the Fuzzy C-Means classifier (FCM) [27Rezaee MR, Nyqvist C, Zwet PMJ, Jansen E, Reiber JHC. Segmentation of MR images by a fuzzy c-mean algorithm In: Computers in cardiology. Vienna, Austria 1995; pp. 21-4.].
More specifically, in feature extraction from ERP data, an initial random selection of inputs, i.e. ERP recordings (in terms of kind and number) is considered. For this selection, the MVAR coefficients are extracted, constructing the feature vector for each subject. These coefficients are fed to a classifier, based on the FCM algorithm, and the classification rate is then calculated. After several iterations, as defined by the SA algorithm, an optimum combination of ERP recordings is extracted corresponding to the best classification rate achieved.
According to the aforementioned MVAR model, a feature vector was constructed with a dimensionality of pxdxd, where p is the model order and d is the number of ERP signals.
2.3. Classification Module
The classification module consisted of a Multi-layer Perceptron Artificial Neural Network (MLP ANN) trained with the back-propagation algorithm. The selection of the topology of the ANN is a methodological aspect that was investigated in the present work. Various methodologies for the selection of the number and the size of hidden layers in ANNs have been used, including evolutionary strategies and genetic algorithms [28Arifovic J, Gencay R. Using genetic algorithm to select architecture of a feedforward neural network Physica A 2001; 289: 574-94., 29Baumgart-Schmitt R, Herrmann WM, Eilers R, Bes F. On the use of neural network techniques to analyse sleep EEG data. First communication: application of evolutionary and genetic algorithms to reduce the feature space and to develop classification rules Neuropsychobiology 1997; 36: 194-210.], network pruning techniques [30Reed R. Pruning algorithms - a survey IEEE Trans Neural Netw 1993; 4: 740-.], network growing techniques [31Jerez-Aragones JM, Gomez-Ruiz JA, Ramos-Jimenez G, Munoz-Perez J, Alba-Conejo E. A combined neural network and decision trees model for prognosis of breast cancer relapse Artif Intell Med 2003; 27: 45-63.], as well as extensive network architecture search [32Chen Y, Kopp GA, Surry D. Interpolation of wind-induced pressure time series with an artificial neural network J Wind Eng Ind Aerodyn 2002; 90: 589-615.].
In the present work, we opted for an extensive network architecture search strategy, scanning combinations of network structure parameters, in order to compare the performance of 3-layered and 4-layered networks with one or two output neurons. Specificity was computed as the percent ratio of the correctly classified correct actions (observations of correct actions) to the total number of correct actions (observations of correct actions). Sensitivity was computed as the percent ratio of the correctly classified incorrect actions (observations of incorrect actions) to the total number of incorrect actions (observations of incorrect actions). Negative predictive value was computed as the percent ratio of correctly classified correct actions (observations of correct actions) to the total number of actions classified as correct (observations of correct actions) and positive predictive value the percent ratio of correctly classified incorrect actions (observations of incorrect actions) to the total number of actions classified as incorrect (observations of incorrect actions). The overall classification rate (CR) was computed as the percent ratio of correctly classified actions (observations of actions) to the total number of actions (observations of actions).
As a result of the network structure selection investigation, based on empirical test results using the set of data of the present study, the classification module was implemented with an ANN consisting of three layers. The input layer consisted of a number of neurons equal to the number of the selected features. The hidden layer contained a number of neurons equal to one fifth of the input neurons. The output layer consisted of one neuron, encoding the two classes of actions (observations): correct actions (observations of correct actions) and incorrect actions (observations of incorrect actions). In addition to the MLP ANN classifier, the Fuzzy C-Means classifier (FCM) [27Rezaee MR, Nyqvist C, Zwet PMJ, Jansen E, Reiber JHC. Segmentation of MR images by a fuzzy c-mean algorithm In: Computers in cardiology. Vienna, Austria 1995; pp. 21-4.] was implemented in order to compare its classification performance with the results of the MLP ANN.
3. MEASUREMENT AND COMPUTATIONAL METHODS
3.1. Subjects and ERP Recording Procedure
The ERP data used in the present study were collected in previous research [11van Schie H, Mars RB, Coles MGH, Bekkering H. Modulation of activity in medial frontal and motor cortices during error observation Nat Neurosci 2004; 7: 549-.]. The data were acquired from 16 healthy volunteers. Participants were faced in front of a table facing an experimenter, having in front of them, on the table, two joystick devices positioned to the left and right of a LED stimulus device. Participants took part in an execution condition and an observation condition. In the execution condition they had to perform an Eriksen flanker task. In this kind of choice reaction tasks, used in Cognitive Psychology research, a participant is expected to respond to a centered and directed item surrounded or flanked by distracting symbols, such as arrows or letters [33Eriksen BA, Eriksen CW. Effects of noise letters upon the identification of a target letter in a nonsearch task Percept Psychophys 1974; 16: 143-9., 34Stins JF, Polderman TJC, Boomsma DI, de Geus EJC. Conditional accuracy in response interference tasks: Evidence from the eriksen flanker task and the spatial conflict task Adv Cogn Psychol 2007; 3: 389-96.]. In the experiment used in [11van Schie H, Mars RB, Coles MGH, Bekkering H. Modulation of activity in medial frontal and motor cortices during error observation Nat Neurosci 2004; 7: 549-.], participants responded to the direction (right or left) of a center arrowhead, by moving the corresponding joystick with the thumb in an outward direction. The center arrowhead was surrounded by four distracting flanker arrowheads, two on each side, pointing either in the same direction as the center arrow (congruent flankers), or in opposite direction (incongruent flankers). In the observation condition, subjects observed an experimenter performing the task. EEG activity was recorded from 47 electrodes, labeled 1 to 34 and 37 to 49 in the montage shown in Fig. (2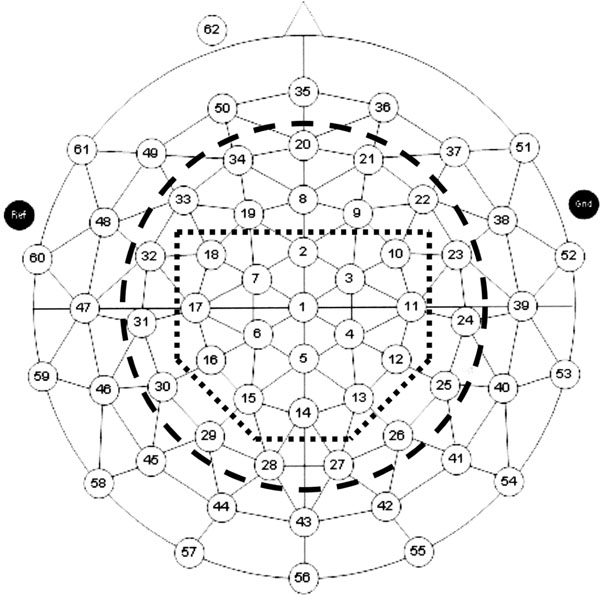 ), as well as vertical and horizontal electro-oculograms. Sampling rate was 250 Hz, and the data used for ERN analysis were filtered using a 1-14Hz bandpass filter. Correct and incorrect trials were averaged separately per condition (execution and observation) over a 700 ms epoch (baseline 100-0 ms before response). Trials to be included in the averaging process had been selected according to an Response Time-matching procedure between correct and incorrect trials (described in [11van Schie H, Mars RB, Coles MGH, Bekkering H. Modulation of activity in medial frontal and motor cortices during error observation Nat Neurosci 2004; 7: 549-.]) to mitigate the differential contribution of stimulus-related activity in the ERP. For the present study one subject average from the execution condition was missing resulting in averages from 15 subjects for the execution condition, and 16 subjects for the observation condition, included for classification.

3.2. Time Interval Selection and Electrode Region Selection for Waveforms MVAR Modeling
The time intervals from the averaged curves, to be used in the present study, for extracting MVAR features were selected as follows: In the study of van Schie et al. [11van Schie H, Mars RB, Coles MGH, Bekkering H. Modulation of activity in medial frontal and motor cortices during error observation Nat Neurosci 2004; 7: 549-.], the difference between correct and incorrect trials was significant in the time window from -6 to 146 msec for the execution condition and in the time window from 90 to 318 msec for the observation condition. Consequently, the actors’ responses were investigated using the -6 to 146 msec time window and the observers’ responses, using the 90 to 318 msec time window. Furthermore, in order to investigate the contribution of ERP components occurring later than the ERN, i.e. the Pe component, a time window starting at -6 msec and ending at 500 msec after response, expected to include the Pe component, was included in the analysis. The question could then be addressed, if availability of the Pe, in addition to the ERN would improve classification performance. Another benefit of choosing the -6 to 500 msec window, was the possibility to compare, in a common time window, the performance of classifiers built for the classification of the ERPs of the actors to the performance of classifiers build for the classification of observers’ ERPs. Lastly, a time window, starting at -6 msec and ending at 700 msec after the response, was selected for analysis, in order to investigate the robustness of the classification with additional noise introduced with longer data windows.
For the selection of electrodes used in the MVAR modeling procedure, the search space was reduced into two sub-regions of the 47 electrodes available. The first sub-region (SR-1) corresponded to 34 electrodes, surrounded by the thick dashed line shown in Fig. (2), excluding the electrodes placed on the external circumference of the 47 electrodes montage. In the second sub-region (SR-2) we focused the search space even more than in the previous region, by focusing at electrodes around the vertex, i.e. only electrodes 1 to 7 and 10 to 18 were kept. SR-2 is surrounded by the thick dotted line shown in Fig. (2).
For both sub-regions, SR-1 and SR-2, the order of the model used varied from 3 to 13 and the number of electrodes in each combination varied from 2 to 8. The MVAR parameters were extracted for the aforementioned time intervals, i.e. -6 to 146 msec, -6 to 500 msec and -6 to 700 msec, for the execution condition and 90 to 318 msec, -6 to 500 msec and -6 to 700 msec, for the observation condition, respectively.
3.3. ANN Training and Testing Procedure
The back-propagation algorithm with adaptive learning rate and momentum was used to train the ANN [35Haykin S. Neural Networks. New York, NY: MacMillan 1994.]. The initial weights of the neurons were randomly selected in the range [-1.0, +1.0]. Log-sigmoid and tan-sigmoid activation functions were used for the hidden and the output layer, respectively. The values of the learning rate and the momentum were estimated using a process of trial-and-error, until no further improvement in classification could be obtained.
Training and cross-validation of the ANN, would pose too strong of a computational load, if all combinations of electrodes would have had to be used. Instead, the speed of the optimization procedure provided by the SA algorithm, in combination with the FCM method, was used for eliminating the need for extensive search. According to this scheme, the FCM algorithm was the first classifier to be used. Then, for each time interval checked, the electrodes that provided the best classification rates for the FCM algorithm, were the electrodes whose MVAR features were used as inputs to the ANN. The leave-one-out cross-validation procedure [36Schenker B, Agarwal M. Cross-validated structure selection for neural networks Comput Chem Eng 1996; 20: 175-86.] was adopted to test the performance of the network in a reliable manner, taking into account the limited number of cases available in the classes, and in the same time achieving an acceptable generalization in the classification and avoiding overtraining.
4. RESULTS
The grand average curves for representative electrodes of SR-1 for the actors’ ERPs correct and incorrect responses are presented in Fig. (3a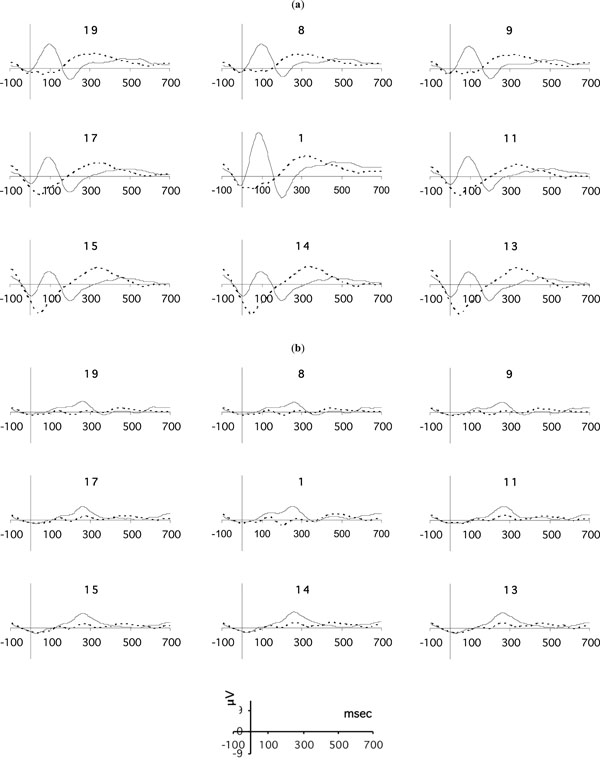 ), and for the observers’ ERPs in Fig. (3b). Classification results obtained with the MVAR/SA method, for both actors and observers (correct or incorrect actions), for both classification systems (the MLP-ANN classifier and the FCM method) are presented in Table 1.


Concerning the classifiers built for discriminating correct and incorrect actions based on actors’ ERPs, as can be seen in Table 1, the best overall classification performance for sub-region SR-1 was 86% for every time interval investigated, using an order of p=4. Results were similar for both the FCM classifier and the ANN classifier using cross-validation. For sub-region SR-2, classification performance again reached 86%, but only for the -6 to 500 msec time window, again for an order of p=4. Nevertheless, the classification performance reached levels equal or higher than 80% for all time intervals used in SR-2, and again the two classification systems (the ANN with cross-validation and the FCM method) proved to provide similar overall classification rate, when results are inspected overall.
Concerning the classifier built for discriminating the observation of correct and incorrect actions based on observers’ ERPs, again classification rates higher or equal to 80% were reached, for both sub-regions, SR-1 and SR-2, but only for the intervals from -6 to 500 msec and -6 to 700 msec. In both cases, the optimal order was p=5. Classification performance based on the window selected to fit the observation ERN fell just below 80%, reaching a classification performance of 78% for both sub-regions, SR-1 and SR-2, respectively. The best classification performance (87%) was reached for sub-region SR-2 using the FCM method for the time interval -6 to 500 msec. The truth tables for the best classification performance for both actors and observers are presented in Table 2.

By inspecting the truth Table 2a for the case of the best overall classification performance for actors’ actions, using sub-region SR-1, in the time window -6 to 146 msec, which was achieved using the MLP-ANN classifier with cross validation, we must note the excellent sensitivity (100%) and excellent negative predictive value (NPV) (100%), while the system generates specificity and positive predictive (PPV) values that are lower than 80%. The inspection of the truth Table 2b for the best overall classification performance for actors’ actions in sub-region SR-2, which occurred using the MLP-ANN classifier with cross validation, for the time window -6 to 500 msec, indicates a sensitivity and NPV greater than 90%, while the specificity and PPV remains at levels higher than 80%. Truth Table 2c for the case of best overall classification performance for observations of actions by the observers, which occurred for sub-region SR-1, in time window -6 to 700 msec, using the MLP-ANN classifier with cross validation, indicates a sensitivity and NPV greater than 90%. Finally, the truth Table 2d for the case of best overall classification performance for observations of actions by the observers, which occurred for sub-region SR-2, in time window -6 to 500 msec, using the FCM method, is very similar to the truth table of Table 2b and indicates again a sensitivity and NPV greater than 90%, while the specificity and PPV remains at levels higher than 80%.


The combinations of electrodes providing the best classification results, whose truth tables have been presented above, are shown in Fig. (4 ). The squares present the electrodes whose AR parameters were used in the MVAR/SA model providing the best overall classification rate of actors’ actions and of observers’ observations for specific time intervals and for the sub-regions SR-1 and SR-2, which are included within the thick dashed and dotted lines, respectively. For the actors, in region SR-1, in the case providing the best classification rate, i.e. the classifier based on the -6 to 146 msec interval, electrodes used included anterio-frontal, central and centro-parietal and a left parietal electrode. For the SR-2 region, in the case providing the best classification rate, i.e. the classifier based on the -6 to 500 msec interval, electrodes used included only two right central and centro-posterior electrodes. In the observation condition, for SR-1, in the case providing the best classification rate, i.e. the classifier based on the -6 to 700 msec interval, electrodes used included anterior-frontal ones bilaterally, as well as two right central and fronto-central electrodes and the same left parietal electrode as in the actors’ SR-1 case above. For the observation condition and the focused search space (SR-2), the best classification rate was provided for a classifier using features from the ERP at the time interval at -6 to 500 msec and using fronto-central, centro-parietal and a midline parietal electrode. It should be noted, however, that the above approach provides only indirect and two-dimensional indications about relations between brain regions and ERP classification accuracy. More direct inferences about brain regions related to the differential response of both actors and observers, to correct and incorrect actions, can only be gained by using inversion techniques for the three-dimensional localization of brain activity, and applying the methodology of the present study to the time series of the intracranial quantities that these techniques compute [21Vasios CE, Matsopoulos GK, Ventouras EM, et al. Multivariate autoregressive modeling combined with simulated annealing optimization for classifying sources of event related potentials Int J Bioelectromagnetism 2005; 7: 78-81., 37Phillips C, Rugg MD, Friston KJ. Anatomically informed basis functions for EEG source localisation: combining functional and anatomical constraints NeuroImage 2002; 16: 678-95., 38Herrmann MJ, Rommler J, Ehlis A-C, Heidrich A, Fallgatter AJ. Source localization (LORETA) of the error-related negativity (ERN/Ne) and positivity (Pe) Cogn Brain Res 2004; 20: 294-9.].

The robustness of the MVAR/SA method, in terms of classification rate, was tested against two parameters: the model order and the number and kind of electrodes that were combined. Concerning model order, criteria for order selection, such as the Schwarz Bayesian Criterion and the Final Prediction Error Criterion [24Kay SM. Modern Spectral Estimation: Theory and Application In: Englewood Cliffs, NJ: Prentice-Hall 1987.], were examined, yielding that the best representation accuracy was achieved with model order varying from 3 to 8, for all electrode combinations. Additionally, previous research [18Vasios C, Papageorgiou C, Matsopoulos GK, Nikita KS, Uzunoglu N. A decision support system of evoked potentials for the classification of patients with first-episode schizophrenia German J Psychiatry 2002; 5: 78-84., 19Anderson CW, Stolz EA, Shamsunder S. Multivariate autoregressive models for classification of spontaneous electroenchephalogram during mental tasks IEEE Trans Biomed Eng 1998; 45: 277-86.] and experimental trials have pointed out that the optimum classification rate is achieved using similar values of model order. To be complete, however, model orders ranging from 3 to 13 were examined in this study. In Fig. (5a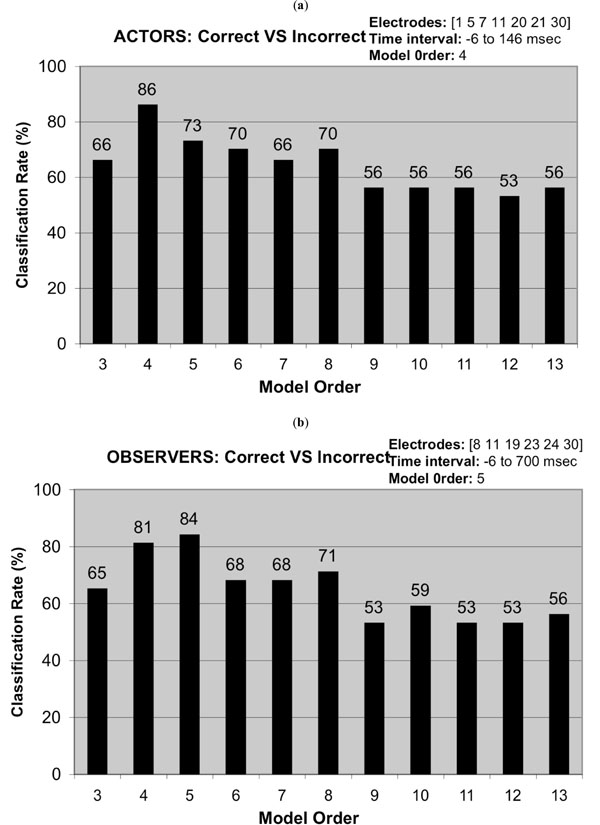 ), the robustness of the MVAR/SA model is presented in terms of the classification rate using the MLP-ANN classifier for different model orders p and for both correct and incorrect actors’ actions in the time window -6 to 146 msec using electrodes [1 5 7 11 20 21 30] for the SR-1 sub-region. From the results, it is evident that the best classification rate was achieved for a model order of p=4 for this specific case as seen in Table 1. Similarly, in Fig. (5b), a model of order p=5 achieved the best classification rate for both correct and incorrect observed actions in the time window -6 to 700 msec using electrodes [8 11 19 23 24 30] for the same sub-region (SR-1).

Apart from using a sub-set of the available electrodes for creating the search space, during the implementation process, the proposed system allowed a maximum number of 8 electrodes to be combined for the calculation of the MVAR coefficients. This decision was also taken in order to reduce the computational complexity of the search process. After several trials, it was found that optimal classification results corresponded to combinations consisting of less than 8 electrodes. As a result, further expansion of the process, by combining more than 8 electrodes, was deemed not necessary. Furthermore, robustness testing of the MVAR/SA method, with respect to the number and kind of electrodes that were combined, indicated that deviation from the combinations selected by the MVAR/SA method leads to deterioration of classification performance. A characteristic result concerning actors’ actions had as follows: According to Table 1, the optimal combination of electrodes provided by the proposed methodology was electrode combination [1 5 7 11 20 21 30], for actors’ actions for a model order of 4 resulting in a classification rate of 86% for the sub-region SR-1. If one of the electrodes, i.e. electrode 21, is omitted the performance is reduced to 83%. If one of the electrodes, i.e. electrode 21, is replaced by another electrode, i.e. electrode 34, the performance is reduced to 80%. Similarly, if a new electrode, i.e. electrode 34, is added to the initial combination of electrodes, a classification rate of 73% is obtained.
5. DISCUSSION
This paper reports an ERP classification method capable of discriminating between an actor’s brain potentials that accompany correct and incorrect responses as well as the brain potentials that occur in an observer looking at those responses. The requirement to use information existing in concurrently recorded ERP waveforms, leads to the creation of an unpractical large search space for selecting the MVAR/SA model providing the best classification rate. The combination of the MVAR model with the SA optimization technique, as proposed in the present work, provides a principled way to reduce the computational complexity of the search process. Nevertheless, even using the SA technique, we followed a gradual approach with respect to the degrees of freedom allowed in the search process, so that a compromise between satisfactory classification rates and computational complexity was reached.
In this framework, the MVAR/SA model in conjunction with two classifiers were implemented towards the classification of correct and incorrect responses, as well as observation of correct and incorrect responses, based on scalp-recorded ERPs of actors and observers. For the classification of actors’ responses, the best overall classification performance reached 86%. The classifier used for discriminating responses viewed by observers achieved an overall classification performance of 87%. In particular, the sensitivity and consequently the NPV reached 100% for the case of actors’ actions in the time interval -6 to 146 msec using the MLP-ANN classifier with cross-validation, indicating that the proposed system was able to completely discriminate all the incorrect actions of actors without any loss. From the obtained results, it is noticeable that in general, both the sensitivity and the NPV remain in high rates (up to 90%) for both actors and observers whereas the specificity and the PPV remains constant in lower rates (up to 80%).
An important aspect of our study was the selection of specific time windows from ERPs of actors and observers. Specifically, for the actors’ data, the time interval -6 to 146 msec was selected to include the ERN as reported in the original study of van Schie et al. [11van Schie H, Mars RB, Coles MGH, Bekkering H. Modulation of activity in medial frontal and motor cortices during error observation Nat Neurosci 2004; 7: 549-.]. A time interval from 90 to 318 msec was selected to fit the observers’ ERN in conformance to the original findings ([11van Schie H, Mars RB, Coles MGH, Bekkering H. Modulation of activity in medial frontal and motor cortices during error observation Nat Neurosci 2004; 7: 549-.]). An additional interval from -6 to 500 msec was included to investigate the contribution of ERP components occurring later than the ERN, i.e. the Pe component. A final interval from -6 to 700msec was included to investigate the robustness of the classification with additional noise introduced with longer data windows. Results indicate that the classification of responses based exclusively on the ERN is possible. Furthermore, results indicate that the inclusion of the time window overlapping with the ERN and the Pe provides a small improvement, as e.g. indicated in the case of SR-2 for the execution actors’ condition, and in a more pronounced way in both sub-regions in the observation condition. The use of the longest data window, which was hypothesized to introduce signals unrelated to the cognitive processes under investigation, provided mixed results. In some cases a slight deterioration of performance was apparent, such as in SR-2 for both conditions, while in the case of SR-1 in the observation condition an improvement was noted. This suggests that classification performance maintains its robustness when more prolonged data intervals are analyzed.
The search space for electrodes used in the MVAR/SA modeling procedure was reduced to two sub-regions of the total 47 electrodes available: The sub-region SR-1 corresponded to 34 electrodes, excluding the electrodes placed on the external circumference of the 47 electrode montage and sub-region SR-2 focused on electrodes located around the vertex. The aim of this search space reduction was primarily to reduce the computational complexity of the feature extraction and classification problem, without affecting the classification performance. The reduction was based on the fact that scalp ERN difference-wave distributions ([11van Schie H, Mars RB, Coles MGH, Bekkering H. Modulation of activity in medial frontal and motor cortices during error observation Nat Neurosci 2004; 7: 549-.]), for both execution and observation conditions, are subdued at peripheral electrode positions. Results indicate that there were no clearly discernible differences between the classifiers built, on the basis of electrode features of the two sub-regions. Furthermore, little consistency was found between the location of electrodes for SR-1 and SR-2 solutions of actor and observer data, suggesting that both the selection of sub-regions and the nature of the error signal (actor/observer generated) may largely influence the optimal choice of electrodes that may be used for classification.
Additionally, an investigation of the robustness of the MVAR-SA method was performed, in terms of classification rate, for the selection of the model order and the number and kind of electrodes that were combined. The analysis indicated that model orders of p=4 and p=5 provided the best classification results for the execution and observation condition respectively, and deviation from the electrode combinations selected by the MVAR/SA method resulted in deterioration of classification performance.
The performance of the proposed classification system was tested with two different classifiers, i.e. the MLP-ANN classifier and the FCM algorithm. From the results in Table 1, it can be seen that both classifiers achieved similarly high classification rates. In the actor condition, the MLP-ANN classifier using the cross-validation method slightly outperformed the FCM method. It must be pointed out that the MLP-ANN classifier for the actors’ ERPs in the time window -6 to 146 msec provided excellent sensitivity (up to 100%) and consequently excellent NPV. For the observers’ actions, the FCM method achieved slightly better classification rates than the MLP ANN classifier, especially for the time intervals -6 to 500 msec and the sub-region SR-2.
In conclusion, the present study showed that the MVAR approach can be used reliably for the classification of brain potentials accompanying erroneous and correct actions, both for actors and observers. The additional SA technique may be used confidently to minimize the search space for the selection of relevant features such as the amount and set of electrodes, the model order, and the data interval, leading to the best classification performance. The two classifiers that were investigated, the MLP ANN method and the FCM approach yielded similarly high level performance rates, suggesting that both models may be used interchangeably for classification of brain potentials associated with correct and incorrect behaviors. The analysis of different time windows revealed comparable performance for all three intervals, suggesting that the MVAR model is largely unaffected when time intervals are prolonged. Results suggest a slight improvement for the classification of brain potentials of observers when the Pe is included in the data interval in addition to the ERN. For the actor condition the ERN provides an optimal signal for classification, with little or no improvement from inclusion of the Pe. Both the selection of sub-regions (30 electrodes or 16 electrodes) and the nature of the signal (from the actor or from the observer) may largely influence the optimal selection of electrodes for classification. Among other benefits, automated classification systems, through the features providing best classification results, provide indications about underlying mechanisms related to pathological processes, when the systems are applied to neuropsychiatric disorders. In this perspective, future research will include the evaluation of the classification system in data from patient populations that had been investigated in the framework of error processing research such as patients suffering from Attention deficit hyperactivity disorder, obsessive-compulsive disorder, depression and schizophrenia [39Ullsperger M. Performance monitoring in neurological and psychiatric patients Int J Psychophysiol 2006; 59: 59-69.]. Insights might be provided both about potential mechanisms of the illnesses and error monitoring [10Taylor SF, Stern ER, Gehring WJ. Neural systems for error monitoring: recent findings and theoretical perspectives Neuroscientist 2007; 13: 160-72.]. Finally, with knowledge gained from the medical applications, in a more general context, our study may foster the future development of systems capable of automatically detecting erroneous actions in human-human and human-artificial agent interactions. In this perspective, future work will include the performance evaluation of the above classification algorithms on single-trial recordings of both actors and observers performing controlled joint-action tasks, for the implementation of classification systems, that will eventually enable the discrimination between such actions in real-time, with applications in fields were human performance monitoring is critical, such as flying, driving and industrial process monitoring.
ACKNOWLEDGEMENTS
The present study was supported by the EU-Project “Joint Action Science and Technology” (IST-FP6-003747). The authors would like to thank Dr. Ruud G.J. Meulenbroek for his constructive comments.