- Home
- About Journals
-
Information for Authors/ReviewersEditorial Policies
Publication Fee
Publication Cycle - Process Flowchart
Online Manuscript Submission and Tracking System
Publishing Ethics and Rectitude
Authorship
Author Benefits
Reviewer Guidelines
Guest Editor Guidelines
Peer Review Workflow
Quick Track Option
Copyediting Services
Bentham Open Membership
Bentham Open Advisory Board
Archiving Policies
Fabricating and Stating False Information
Post Publication Discussions and Corrections
Editorial Management
Advertise With Us
Funding Agencies
Rate List
Kudos
General FAQs
Special Fee Waivers and Discounts
- Contact
- Help
- About Us
- Search


The Open Medical Informatics Journal
(Discontinued)
ISSN: 1874-4311 ― Volume 13, 2019
Evaluation of Quantitative EEG by Classification and Regression Trees to Characterize Responders to Antidepressant and Placebo Treatment
M Rabinoff*, 1, C.M.R Kitchen2, I.A Cook 1, 3, A.F Leuchter1, 3
Abstract
The study objective was to evaluate the usefulness of Classification and Regression Trees (CART), to classify clinical responders to antidepressant and placebo treatment, utilizing symptom severity and quantitative EEG (QEEG) data. Patients included 51 adults with unipolar depression who completed treatment trials using either fluoxetine, venlafaxine or placebo. Hamilton Depression Rating Scale (HAM-D) and single electrodes data were recorded at baseline, 2, 7, 14, 28 and 56 days. Patients were classified as medication and placebo responders or non-responders. CART analysis of HAM-D scores showed that patients with HAM-D scores lower than 13 by day 7 were more likely to be treatment responders to fluoxetine or venlafaxine compared to non-responders (p=0.001). Youden’s index γ revealed that CART models using QEEG measures were more accurate than HAM-D-based models. For patients given fluoxetine, patients with a decrease at day 2 in θ cordance at AF2 were classified by CART as treatment responders (p=0.02). For those receiving venlafaxine, CART identified a decrease in δ absolute power at day 7 at the PO2 region as characterizing treatment responders (p=0.01). Using all patients receiving medication, CART identified a decrease in δ absolute power at day 2 in the FP1 region as characteristic of nonresponse to medication (p=0.003). Optimal trees from the QEEG CART analysis primarily utilized cordance values, but also incorporated some δ absolute power values. The results of our study suggest that CART may be a useful method for identifying potential outcome predictors in the treatment of major depression.
Article Information
Identifiers and Pagination:
Year: 2011Volume: 5
First Page: 1
Last Page: 8
Publisher Id: TOMINFOJ-5-1
DOI: 10.2174/1874431101105010001
Article History:
Received Date: 8/5/2010Revision Received Date: 17/10/2010
Acceptance Date: 9/12/2010
Electronic publication date: 11/2/2011
Collection year: 2011
open-access license: This is an open access article licensed under the terms of the Creative Commons Attribution Non-Commercial License (http://creativecommons.org/licenses/by-nc/3.0/) which permits unrestricted, non-commercial use, distribution and reproduction in any medium, provided the work is properly cited.
* Address correspondence to this author at the Department of Psychiatry and Biobehavioral Sciences, University of California, Los Angeles, CA, USA; Tel: 408-972-3288; Fax: 408-972-3242; E-mail: MRabinoff@mednet.ucla.edu
| Open Peer Review Details | |||
|---|---|---|---|
| Manuscript submitted on 8-5-2010 |
Original Manuscript | Evaluation of Quantitative EEG by Classification and Regression Trees to Characterize Responders to Antidepressant and Placebo Treatment | |
INTRODUCTION
Clinicians long have observed a lag time between initiating antidepressant treatment and clinical response [1Hyman SE, Nestler EJ. Initiation and adaptation: a paradigm for understanding psychotropic drug action Am J Psychiatry 1996; 153: 151-62., 2Katz MM, Koslow SH, Frazer A. Onset of antidepressant activity: reexamining the structure of depression and multiple actions of drugs Depress Anxiety 1996; 4: 257-67.]. Some individuals do exhibit early symptomatic improvement, and this has been reported to predict further improvement over the next several weeks [3Nierenberg AA, McLean NE, Alpert JE, Worthington JJ, Rosenbaum JF, Fava M. Early nonresponse to fluoxetine as a predictor of poor 8-week outcome Am J Psychiatry 1995; 152: 1500-3.]. Reports have suggested that some physiologic changes are seen shortly after initiation of treatment [4Sulser F. New perspectives on the molecular pharmacology of affective disorders Eur Arch Psychiatry Neurol Sci 1989; 238: 231-9.-6Dahmen N, Fehr C, Reuss S, Hiemke C. Stimulation of immediate early gene expression by desipramine in rat brain Biol Psychiatry 1997; 42: 317-23.], including studies employing a quantitative EEG (QEEG) measure, cordance. Among QEEG measures, cordance is more strongly correlated with regional cerebral perfusion than other measures [7Leuchter AF, Uijtdehaage SHJ, Cook IA, O’Hara R, Mandelkern M. Relationship between brain electrical activity and cortical perfusion in normal subjects Psychiatr Res Neuroimaging 1999; 90: 125-40.] and thus can be interpreted in the context of neuroimaging studies of brain function during treatment for depression. In both open-label case series [8Cook IA, Leuchter AF. Prefrontal changes and treatment response prediction in depression Semin Clin Neuropsychiatry 2001; 6: 113-20., 9Cook IA, Leuchter AF, Morgan ML, Stubbeman W, Siegman B, Abrams M. Changes in prefrontal activity characterize clinical response in SSRI nonresponders: a pilot study J Psychiatr Res 2005; 39: 461-6.] and with a double-blind placebo-controlled clinical trial paradigm [10Cook IA, Leuchter AF, Morgan M, et al. Early changes in prefrontal activity characterize clinical responders to antidepressants Neuropsychopharamcology 2002; 27: 120-31.], early changes in prefrontal values of θ-band cordance were significantly related to later clinical outcome. There would be great clinical use for features -- physiologic, symptomatic, or otherwise -- that could predict outcome as close as possible to the initiation of treatment; we sought to understand how physiologic biomarkers and clinical data could be examined with innovative methods to refine the testing of potential predictors.
Because of the large number of possible predictors in the dataset, we used Classification and Regression Trees (CART) [11Brieman L, Friedman J, Olshen R, Stone C. Classification and Regression Trees. Monterey, CA: Wadsworth & Brooks 1984.] to identify parameters that are predictive of treatment response. CART is a nonparametric statistical method that creates binary decision trees for solving classification problems. We compared the results of CART analysis with individual item, sub-scale score and total score on the Hamilton Depression Rating Scale (HAM-D), with CART analysis of QEEG absolute power, relative power, and cordance data, at baseline, 48 hours, 7 days, and at 2 weeks. In an exploratory analysis, we sought to determine whether specific HAM-D items, subscales, or total score, provided for the best CART model of treatment or placebo response, and also to determine which specific electrode locations are the best predictors of treatment response. Finally, we sought to compare CART analysis results for drug-mediated vs placebo (“nonspecific”) response.
METHODS
Study Patients
We studied adults diagnosed with a major depressive episode (MDE) who were patients in one of two separate, double-blind, randomized treatment trials conducted at the UCLA Department of Psychiatry and Biobehavioral Sciences over a 24 month period: one group of patients received fluoxetine or placebo, while patients in the other group received venlafaxine or placebo. All patients were free of psychotropic medication for at least 2 weeks prior to enrollment. Patients were outpatients with unipolar MDE, with diagnoses determined using a structured interview for DSM-IV [12First M, Spitzer R, Gibbon M, Williams J. Structured Clinical Interview for DSM-IV Axis I Disorders – Patient Edition. New York, NY: Biometrics Research Dept., New York State Psychiatric Institute 1994.], and with scores ≥16 on the 17-item Hamilton Depression Rating Scale (HAM-D) at intake. No additional psychotropic medications were permitted during the trials (e.g., no sedative or hypnotic medications). Recruitment mechanisms as well as inclusion and exclusion criteria were identical for both protocols (Table 1). In accordance with principles of the Helsinki Declaration of 1975, both protocols were approved by the UCLA Institutional Review Board, and informed consent to participate in this research was obtained from all patients. Patient confidentiality was maintained for all patients.

A total of 51 patients completed the protocols and were examined for the present report (24 from the fluoxetine vs placebo trial, and 27 from the venlafaxine vs placebo trial), and had been the subject of our previous report on early physiologic changes [10Cook IA, Leuchter AF, Morgan M, et al. Early changes in prefrontal activity characterize clinical responders to antidepressants Neuropsychopharamcology 2002; 27: 120-31.]. Groups (Placebo, Fluoxetine, and Venlafaxine) were comparable at pretreatment baseline on demographic and clinical parameters. We defined clinical response as reduction in final depression severity to a HAM-D score of ≤10 points. The two studies had similar drop-out rates, as well as response rates to medication and placebo. Because of the high degree of comparability of the patients from two trials, data could be pooled.
Experimental Procedures
Fluoxetine and Venlafaxine Treatment Trial Designs
The nine-week protocol employed two phases. Patients first entered a one-week, single-blind placebo lead-in phase. Patients who failed to meet study entry criteria at the end of lead-in (e.g., because of intolerable side effects to placebo, or a strong placebo response (no longer meeting inclusion criteria)) were removed from the protocol and were referred for open-label treatment. Patients eligible to continue in the protocol entered a double-blind phase and were randomized to receive 8 weeks of either placebo or active medication (fluoxetine 20 mg po QD in the first protocol or venlafaxine 150 mg po QD in the second) dispensed in identical capsules. Patients receiving fluoxetine were given 20 mg/d and continued at that dose for the 8 weeks; patients receiving venlafaxine began at 37.5 mg/d, increased over a week to 150 mg/d, and then continued at that dose for the remaining 7 weeks. To preserve blinding, placebo “dose” was escalated in that trial.
All patients received brief sessions of supportive psychotherapy during the blinded phase of the study, in order to address safety concerns about dispensing placebo alone to patients with significant depression (15-25 minutes of unstructured counseling and assistance in problem solving by a research nurse at the follow-up visits). Follow-up visits for symptom/side effect monitoring and for the supportive therapy took place at two days and at weekly intervals thereafter after the start of the double-blind phase of the study. Symptoms were monitored with a focused clinical interview, clinician rating scales (e.g., HAM-D), and self-rating scales. At the end of the 8 week double-blind phase, the blinding was broken and HAM-D scores were used to categorize patients as responders or non-responders.
QEEG Data Acquisition
QEEG recordings were obtained (a) at pretreatment baseline prior to randomization, (b) at 48 hours (after two doses of drug or placebo), and (c) after 1 week on medication or placebo, as shown in Fig. (1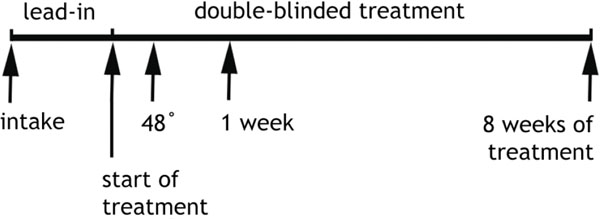 ). Recordings were made with the QND System (Neurodata, Inc., Pasadena, CA), using procedures employed in our previous reports and summarized here. Patients were instructed to rest in the eyes-closed, maximally alert state, in a quiet room with subdued lighting. The technicians monitored the QEEG data in real-time during the recording, and re-alerted the patients every 30-45 seconds as needed to avoid drowsiness. Electrodes were placed with an electrode cap (ElectroCap, Eaton, OH) using 35 recording electrodes distributed across the head according to the International 10-20 System arrangement (Fig. 2
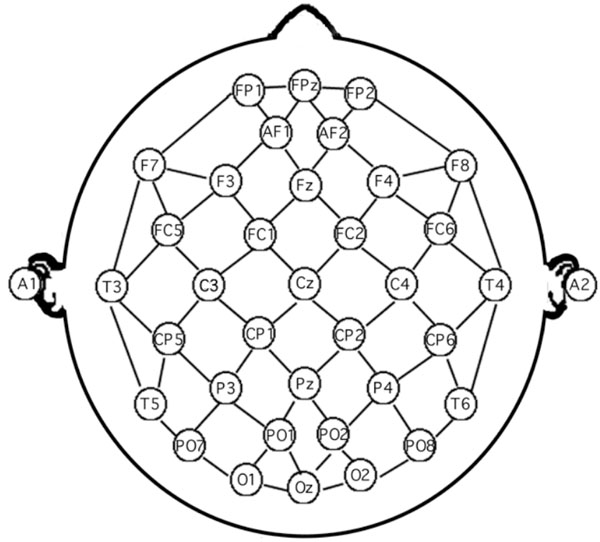 ). Data were collected using a Pz referential montage and were digitized at 256 samples/channel/sec by the QND system (bandpass filtered 0.3 - 70 Hz).
 |
Fig. (1) Experimental Protocol Timeline. Subjects were assessed and enrolled at “intake”, had the pretreatment baseline EEG recorded at that time, and then participated in a one week, single-blind placebo lead-in phase. Randomization to treatment modality (active medication or placebo) took place at the time marked “start of treatment”, Another EEG was recorded after 48 hours of treatment and again at 1 week. Clinical assessment to determine outcome (responder vs non-responder) took place after 8 weeks of treatment (9 weeks in study altogether). Subjects were monitored weekly during the double-blind treatment (arrows not shown) for clinical changes and adverse reactions [10Cook IA, Leuchter AF, Morgan M, et al. Early changes in prefrontal activity characterize clinical responders to antidepressants Neuropsychopharamcology 2002; 27: 120-31.]. |
 |
Fig. (2) Electrode montage. The 35 scalp electrodes from the extended International 10-20 system. Line segments denote bipolar channels used in the reattributional montage. Electrodes included in the calculation of average prefrontal cordance are Fp1, Fp2, and Fpz [14Cook IA, O’Hara R, Uijtdehaage SHJ, Mandelkern M, Leuchter AF. Assessing the accuracy of topographic EEG mapping for determining local brain function Electroencephalogr Clin Neurophysiol 1998; 107: 408-14.]. |
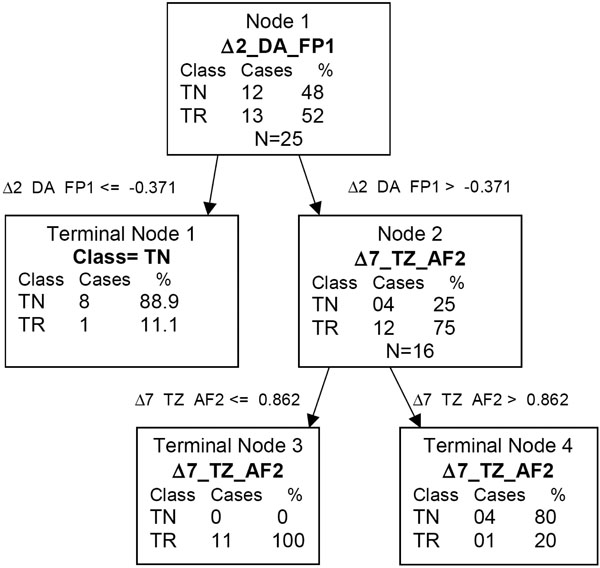 |
Fig. (3) QEEG CART tree of fluoxetine and venlafaxine. Δ2_DA_FP1 = the change from baseline to day 2 for δ absolute score at FP1. Δ7_TZ_AF2 = the change from baseline to day 7 for θ Z score at AF2. |
Each EEG recording was reviewed by a technician who was blinded to the identity of the patient, treatment condition, and clinical status; the first 20-32 seconds of artifact-free data were selected to be processed. A second technician reviewed these selections for accuracy. These selections were then processed using a fast Fourier transform to obtain absolute and relative power values in four frequency bands (0.5-4 Hz, 4-8 Hz, 8-12 Hz, and 12-20 Hz). “Absolute power” describes the amount of power in a frequency band at a given electrode (measured in µV2), and “relative power” is the percentage (%) of power contained in a frequency band, relative to the total power across the entire spectrum (0.5-20 Hz) computed separately for each electrode. The QEEG data were reformatted offline to compute linked-ear-reference absolute and relative power values; these values were used in the regional measure analyses described below. QEEG data were also reformatted to bipolar channel pairs and processed further to yield cordance values (below).
Cordance Calculations
Cordance was calculated by combining conventional QEEG absolute and relative power measures in a common metric, and was computed in three steps using methods we have detailed previously [13Leuchter AF, Cook IA, Uijtdehaage SHJ, et al. Brain structure and function, and the outcomes of treatment for depression J Clin Psychiatry 1997; 58(suppl 16): 22-31., 14Cook IA, O’Hara R, Uijtdehaage SHJ, Mandelkern M, Leuchter AF. Assessing the accuracy of topographic EEG mapping for determining local brain function Electroencephalogr Clin Neurophysiol 1998; 107: 408-14.] and described briefly here. First, EEG power values were computed using a re-attributional electrode montage (Fig. 2) because that montage afforded the highest correlation between EEG measures and PET measures of regional cerebral blood flow. Second, these values were normalized across all electrode sites using a z-transformation, yielding Anorm(s,f) & Rnorm(s,f) for all sites s and frequency bands f. Third, cordance values (Z) were formed as the sum of Anorm and Rnorm.
Z(s,f) = Anorm(s,f) + Rnorm(s,f)
Data Analysis and Statistical Methods
Software
Software utilized for statistical analysis included SAS version 8 (SAS Institute, Cary, NC), and for CART analysis, Salford Systems’ CART version 5.0 (Salford Systems, San Diego CA).
Patient Categorization
Patients were categorized both by treatment (fluoxetine, venlafaxine or placebo) and by outcome (response/non-response). A final 17-item HAM-D score of ≤10 at the end of the 8 week double-blind phase was used to define the responders [10Cook IA, Leuchter AF, Morgan M, et al. Early changes in prefrontal activity characterize clinical responders to antidepressants Neuropsychopharamcology 2002; 27: 120-31., 15Cook IA, Leuchter AF, Uijtdehaage SHJ, Abrams M, Anderson-Hanley C, Rosenberg-Thompson S. Neurophysiologic predictors of treatment response to fluoxetine in major depression Psychiatr Res 1999; 85: 263-73.]. As noted earlier, patients from the fluoxetine and venlafaxine trials did not differ significantly in response rates or demographic parameters and thus were pooled for these analyses. Outcomes were evaluated using the entire HAM-D scores, and also using two frequently-employed unidimensional subscales derived from the full HAM-D: the Bech Melancholia subscale [16Bech P, Gram LF, Dein F, Jacobsen O, Vitger J, Bolwig TG. Quantitative rating of depressive states Acta Psychiatr Scand 1975; 51: 161-70.] (Bech et al., 1975) and Maier-Philipp Severity subscale [17Maier W, Philipp M, Gerken A. Dimensions of the Hamilton Depression Scale. Factor analysis studies Eur Arch Psychiatr Neurol Sci 1985; 234: 417-22.]. These were considered because, in a meta-analysis by Faries et al. [18Faries D, Herrara J, Rayamajhi J, DeBrota D, Demitrack M, Potter WZ. The responsiveness of the hamilton depression rating scale J Psychiatric Res 2000; 24: 3-10.], they had shown greater size effects and applicability to smaller sample sizes than the full 17-item HAM-D. Both subscales include items 1 (depressed mood), 2 (feelings of guilt), 7 (work and activities), 8 (psychomotor retardation) and 10 (anxiety/psychic). The Bech subscale also includes item 13 (somatic symptoms/general), while the Maier-Philipp subscale includes item 9 (agitation).
Electrode and Regional Analyses
Our primary analyses with QEEG measures employed data from each of the 35 individual electrodes. Based on prior significant findings for the prefrontal region, we also examined the prefrontal region by averaging the individual values from the three prefrontal channels (FP1, FP2, FPZ) as had been done in those earlier reports [9Cook IA, Leuchter AF, Morgan ML, Stubbeman W, Siegman B, Abrams M. Changes in prefrontal activity characterize clinical response in SSRI nonresponders: a pilot study J Psychiatr Res 2005; 39: 461-6., 10Cook IA, Leuchter AF, Morgan M, et al. Early changes in prefrontal activity characterize clinical responders to antidepressants Neuropsychopharamcology 2002; 27: 120-31.].
CART Method
Data were analyzed using classification and regression tree analysis (CART) [11Brieman L, Friedman J, Olshen R, Stone C. Classification and Regression Trees. Monterey, CA: Wadsworth & Brooks 1984.]. This is a novel application of CART analysis to clinical and physiologic data in mood disorders, and so merits more extensive description. CART is a nonparametric statistical methodology that creates binary decision trees: the methodology recursively partitions the parameter space to classify patients by category with the fewest mistakes (termed purity). The binary decision tree contains nodes connected by branches. The root node contains all patients. A binary decision tree is created by partitioning a node into two daughter nodes. The objective of the analysis is to find partitions of the data such that the end nodes (terminal nodes) are as homogeneous as possible. The quantitative measure of node homogeneity is termed the impurity function. The simplest idealization of the impurity function is the number of patients who meet an objective criteria divided by the total number of patients in the node. Ratios close to 0 or 1 are considered more pure.
To partition a node, CART examines all possible splits of the explanatory variables. In general, the number of possible splits for ordinal or continuous variables is 1 less the number of distinctly observed values. A potential split is judged by its reduction of the impurity function for both daughter nodes it creates. The partitioning iteratively continues by splitting both of the daughter nodes into 2 daughter nodes and continues until the tree is saturated, that is, until no further partitions can be performed.
Although the tree grown may fit a given dataset well, it may be overfit to that sample and perform poorly with a different sample. The optimal number of terminal nodes can be determined by cost-complexity pruning [11Brieman L, Friedman J, Olshen R, Stone C. Classification and Regression Trees. Monterey, CA: Wadsworth & Brooks 1984.]. Cost complexity is defined as Rα (T) = R(T) + α |T|, where α is the cost-complexity parameter, R(T) is the misclassification error and |T| is the number of terminal nodes in tree T. Brieman has shown that for any value of α, there is an optimal tree that minimizes the cost-complexity. To find the optimal tree, a cross-validation approach can be used. The data set is split into V subsets and a tree is constructed from V-1 subsets and validated on the sample that was left out. The procedure is repeated V times producing V trees. The average of the prediction errors across all trees of a certain complexity is used as the final prediction error. The optimal tree is selected as the minimum size tree among those trees whose cross-validation error is within 1 standard deviation of the minimum cross-validation error.
An advantage of CART is its handling of missing data through surrogate variables. For every split, CART examines the primary splitter as well as other variable splits that minimize impurity. A surrogate split attempts to mimic the result of the primary split. Another advantage of CART is its handling of variable interactions. The binary tree structure shows the effects of variable interactions at the optimal splits. Logistic regression is a special case of CART. However with a large number of parameters it is computationally infeasible to examine every possible subset along with their interactions with logistic regression. CART’s utility is that its algorithm does exactly that and determines the combination of variables that best increase its predictive power.
Sensitivity, specificity, and positive- and negative-predictive values were calculated using entire trees. We also calculated the likelihood ratio of a negative test which is defined as (1-specificity)/ sensitivity, the likelihood ratio of a positive test which is defined as sensitivity/ (1-specificity), and Youden’s index γ which is defined as sensitivity + specificity -1, all of which are summary measures of both sensitivity and specificity [19Hilden J, Glasziou P. Regret graphs, diagnostic uncertainty and Youden's index Stat Med 1996; 15: 969-86.]. Models were compared using Youden’s index where higher values of γ are desirable. Single node trees were assessed using Fisher’s exact test.
Treatment response served as the primary outcome variable used for the analyses. Potential predictors of treatment response were HAM-D individual items, Bech and Maier-Philipps subscales, and total score at baseline, 2 and 7 days, QEEG scores at baseline, 2 and 7 days. Models were compared using Youden’s index γ.
RESULTS
Clinical Response
Thirteen of 25 patients (52%) responded to medication: seven of 13 patients (54%) responded to treatment with fluoxetine, and six of 12 (50%) responded to venlafaxine. Response rates to medication between the two studies were not statistically different. The placebo response rate was 38% (10 of 26). A majority of patients in both responder groups had sustained decreases in depression rating scores (7/13 M-R and 7/10 P-R). Clinical differences between groups did not emerge until 4 weeks of treatment. Responders were significantly different from non-responders on final HAM-D (F(1,49)=121.4, p< 0.0001). Both responder groups had comparable clinical outcomes (final HAM-D 6.0 ± 3.1 for M-R and 6.1 ± 3.4 for P-R); both non-responder groups also showed equivalent clinical endpoints (final HAM-D 18.4 ± 4.6 for M-NR and 17.9 ± 4.5 for P-NR).
Logistic Regression Analyses of Clinical Data
For venlafaxine and fluoxetine combined, medication non-responders were more likely to have HAM-D total scores greater or equal to 13 compared to treatment responders at 1 week of treatment (p=0.001 by Fisher’s exact test). The sensitivity of this test was 0.73 with 100% specificity. The positive predictive value was 1 and the negative predictive value was 0.786. Youden’s index γ was 0.73. The likelihood ratio of a negative test was 0.27. Total HAM-D score at week 1 was also significant by logistic regression OR=0.762 (CI 0.606, 0.959), p=0.02. We also assessed individual HAM-D scores at baseline in terms of treatment response, and found no significant association between initial HAM-D scores and outcomes. For patients receiving placebo, those with scores less than 2 on item 6 of the HAM-D scale (late insomnia) at baseline were more likely to be placebo responders (p=0.05). The sensitivity of this test was 100% and the specificity was 0.47. The positive predictive value was 0.47, negative predictive value 1. The likelihood ratio of positive test was 1.89 and the likelihood ratio of a negative test was 0. Youden’s index γ was 0.47 (Table 2).
CART Analysis of QEEG Data
QEEG change scores were calculated as change in QEEG scores from baseline to time of recording (day 2, day 7, day 14, day 28 or day 56). Purity was measured using the Entropy criteria and 10-fold cross validation was used to assess the stability of the trees. The data were also analyzed by logistic regression.
Using the combined sample of fluoxetine and venlafaxine, patients with a change from baseline to day 2 in δ absolute power at FP1 ≤ -0.371 were less likely to be treatment responders (P=0.0034). Looking further down the classification tree, medication responders were more likely to have a change from baseline to day 2 in δ absolute power at FP1 > -0.371, and have change from baseline to 7 day for θ cordance at AF2 ≤ 0.862. Overall, 11 of 13 treatment responders and 12 of 12 treatment non-responders were correctly classified. The sensitivity of this test was 0.85 and the specificity was 100%. The positive predictive value was 1 and the negative predictive value was 0.86. The likelihood ratio of a negative test was 0.15 and γ was 0.85. The CART results are given in Fig. Fig. (3 ).
).
Each medication was then considered separately. For fluoxetine, patients with a change from baseline to day 2 in θ cordance at AF2 < -0.336 were more likely to be treatment responders than patients with higher changes (p=0.021 by Fisher’s exact test). Five of 7 treatment responders and 6 of 6 treatment non-responders were correctly classified. The sensitivity of this test was 0.71 and the specificity was 100%. The positive predictive value was 1 and the negative predictive value was 0.75. The likelihood ratio of a negative test was 0.29 and γ was 0.71.
For venlafaxine, patients with changes from baseline to day 7 in δ absolute power at PO2 < -0.557 were more likely to be treatment responders (p=0.015 by Fishers exact test). Five of 6 treatment responders and 6 of 6 treatment non-responders were correctly classified. The sensitivity of this test was 0.83 and the specificity was 100%. The positive predictive value was 1 and the negative predictive value was 0.86. The likelihood ratio of a negative test was 0.17 and γ was 0.83. The CART results are given in Fig. Fig. (3). Placebo non-responders were more likely to have θ cordance changes from baseline to day 7 at T4 < 0.202 (p=0.004). Twelve of 16 placebo non-responders were correctly classified and 9 of 10 placebo responders were correctly classified. The sensitivity of this test was 0.90 and the specificity was 0.75. The positive predictive value was 0.69 and the negative predictive value was 0.92. The likelihood ratio of a negative test was 0.13, the likelihood ratio for a positive test was 3.6 and γ was 0.65.
When the average of absolute power, relative power, or cordance values from the 3 individual prefrontal leads were used to examine the prefrontal region as had been done previously [10Cook IA, Leuchter AF, Morgan M, et al. Early changes in prefrontal activity characterize clinical responders to antidepressants Neuropsychopharamcology 2002; 27: 120-31.], the CART method identified no significant relationship between these variables and clinical outcome.
DISCUSSION
Three central findings emerged from this preliminary study. First, the CART method was able to identify clinical features during treatment that were significantly related to outcome. Second, CART confirmed that the use of prefrontal physiologic data is useful in predicting clinical outcome, though with refinement in the regional specificity compared with prior work. Third, response to placebo was associated with changes in temporal activity, a new observation. We believe this report is the first use of CART to examine clinical and physiologic features of response to antidepressant medications, and find that this method merits further use in psychiatric research.
These results are based on a small sample of patients and further studies are necessary to confirm the findings. One should also note that CART also differs from traditional statistical tests in that the objective function for CART is to maximize purity in the groups and not to minimize the error in fitting a functional form. CART also recursively examines every variable as well as the optimal split point for the variable. The hierarchical nature of the tree also yields information about interactions. Owing to the recursive nature of CART, it is not amenable to traditional notions of p-values.
Applying CART to HAM-D score data, we found that patients taking fluoxetine and venlafaxine were more likely to be treatment responders if the total HAM-D score was less than 13 at 1 week of treatment. We also found that patients who were randomized to placebo and had a score less than 2 on item 6 of the HAM-D were more likely to respond to placebo. When we used CART to examine the QEEG data we were able to obtain models that had higher accuracy for both treated and placebo patients.
All of the QEEG data, CART models selected cordance and absolute power measures. Of interest, relative power values were never chosen as optimal predictors. However this is a relatively small sample size, so caution must be used in any generalizations.
Cook et al. [10Cook IA, Leuchter AF, Morgan M, et al. Early changes in prefrontal activity characterize clinical responders to antidepressants Neuropsychopharamcology 2002; 27: 120-31.] found that medication responders uniquely showed significant decreases in prefrontal cordance at 48 hours and 1 week, and that no other brain regions had significant changes. In this study, CART analysis found significant results utilizing single point electrode data within the prefrontal region examined in that prior report. For the optimal CART tree investigating treatment responders versus non-responders, for the initial CART split value, 12 out of 13 treatment responders had change from baseline to day 2 δ absolute power at FP1 > -0.371, while 8 out of 12 treatment responders had scores ≤ -0.371.
In the optimal categorization tree identified by CART, θ cordance and δ absolute power were the only QEEG parameters that were included. Cordance values may be interpreted as reflecting regional cortical perfusion, so that a lower cordance value may reflect less regional activity in the area recorded by the electrode, while a higher value may reflect increased activity. For the optimal CART tree investigating treatment responders versus non-responders for both medications combined, 11 of 12 treatment responders had a lesser increase, or greater decrease, in cordance from baseline to day 7 at AF2 than in the treatment non-responders.
For fluoxetine we found that patients with a change in cordance from baseline to day 2 at AF2 < -0.336 were more likely to be treatment responders than patients with higher changes: fluoxetine treatment responders may have had a greater decrease in cortical perfusion, and neuronal activity, in the area recorded by the AF2 electrode.
Placebo non-responders were more likely to have cordance changes from baseline to day 7 at T4 < 0.202: placebo responders were more likely to have a greater increase in cortical perfusion, and neuronal activity, in the area recorded by the T4 electrode.
These findings are consistent with findings from other researchers showing a decrease in prefrontal cortex metabolism with successful treatment of major depressive disorder with paroxetine [20Brody AL, Saxena S, Stoessel P, et al. Regional brain metabolic changes in patients with major depression treated with either paroxetine or interpersonal therapy: preliminary findings Arch Gen Psychiatry 2001; 58: 631-40.]. In addition, the CART findings regarding placebo responders may provide complementary information about placebo treatment to the findings in a previous study from our lab with the same patients that showed cordance changes suggestive of increased prefrontal cortical perfusion in placebo responders [21Leuchter AF, Cook IA, Witte EA, Morgan M, Abrams M. Changes in brain function of depressed subjects during treatment with placebo Am J Psychiatry 2002; 159: 122-9.].
The different electrodes selected for optimal CART analysis trees for the different medications may reflect the effect of the specific medications on specific areas of the brain (and involved pathways), and in relationship to θ cordance changes, may reflect changes in cortical perfusion induced by the specific medications that have relevance for understanding the mechanisms underlying treatment response (vs non-response).
Of interest, out of 35 electrodes providing data, 4 electrodes provided data selected for optimal CART trees, and all but 1 (FP1) were from outside the prefrontal region. However, data from FP1 was used as the primary split in the optimal CART tree for fluoxetine plus venlafaxine treatment responders vs non-responders.
Prior work with cordance [9Cook IA, Leuchter AF, Morgan ML, Stubbeman W, Siegman B, Abrams M. Changes in prefrontal activity characterize clinical response in SSRI nonresponders: a pilot study J Psychiatr Res 2005; 39: 461-6., 10Cook IA, Leuchter AF, Morgan M, et al. Early changes in prefrontal activity characterize clinical responders to antidepressants Neuropsychopharamcology 2002; 27: 120-31., 21Leuchter AF, Cook IA, Witte EA, Morgan M, Abrams M. Changes in brain function of depressed subjects during treatment with placebo Am J Psychiatry 2002; 159: 122-9.] had identified changes in the prefrontal region as biomarkers of treatment response; those studies tested regional hypotheses and explicitly did not consider the 35 individual electrodes in order to avoid Type II statistical errors. In our present dataset, only prefrontal data from FP1 was included in the optimal CART trees, along with AF2, PO2 and T4 electrodes. These findings suggest that, in addition to considering regions defined in classical neuroanatomical frameworks, future studies should test hypotheses about ensembles of electrodes that may be linked by distributed neuronal networks [22Kumar A, Cook IA. White matter injury, neural connectivity and the pathophysiology of psychiatric disorder Devel Neurosci 2002; 24: 255-61.].
While significance was noted with HAM-D CART analysis, the results could be viewed as reflecting a lesser likelihood of treatment response if patients start with a higher HAM-D score. Optimal QEEG CART analysis in this study found most of the significant electrode points in areas other than the prefrontal cortex, and calculated values for the entire prefrontal region were not found to be significant. These results are not in conflict with the results of a prior study with the same data that only noted significance of the prefrontal cortex when regions of the brain were analyzed [10Cook IA, Leuchter AF, Morgan M, et al. Early changes in prefrontal activity characterize clinical responders to antidepressants Neuropsychopharamcology 2002; 27: 120-31.], and suggest activity at other locations in the brain, such as from the anterior frontal region, may add useful information for predicting active treatment or placebo response. The application of CART methodology was found to be a useful exploratory tool in investigating QEEG data obtained before and during antidepressant and placebo treatment of unipolar depression. These preliminary results need to be replicated with studies with larger patient numbers.
ABBREVIATIONS AND TECHNICAL TERMS
| Absolute power | = The amount of power in a frequency band at a given electrode (measured in µV2) |
| AF2 region | = The part of the anterior frontal brain region that is recorded by the AF1 electrode (see Fig. 2) |
| Alpha-band | = EEG data in the frequency band from 8 up to 12 Hz |
| Beta-band | = EEG data in the frequency band from 12 up to 20 Hz |
| Clinical responder | = A final 17-item HAM-D score of <= 10 at the end of the 8 week double-blind phase |
| Cordance | = A value calculated by combining conventional QEEG absolute and relative power measures in a common metric |
| δ (delta) band | = EEG data in the frequency band from 0.5 up to 4 Hz |
| FP1 region | = The part of the prefrontal brain region that is recorded by the FP1 electrode (see Fig. 2). |
| Negative Predictive Value | = The proportion of patients who are predicted to be non-responders who are actually non-responders |
| PO2 region | = The part of the parietooccipital brain region that is recorded by the PO2 electrode (see Fig. 2) |
| Positive Predictive Value | = The proportion of patients who are predicted to be a treatment responder that are actually treatment responders |
| QEEG | = Quantitative EEG, which involves computer signal processing of EEG data |
| Relative power | = The percentage (%) of power contained in a frequency band, relative to the total power across the entire spectrum (0.5-20 Hz) computed separately for each electrode |
| Sensitivity | = The statistical measure that equals the number of true positives divided by (the number of true positives plus the number of false negatives). Sensitivity measures the proportion of true positives which are correctly identified (e.g. the percentage of sick people who are correctly identified as having the condition) |
| Specificity | = The statistical measure that equals the number of true negatives divided by (the number of true negatives plus the number of false positives). It measures the proportion of true negatives which are correctly identified (e.g. the percentage of healthy people who are correctly identified as not having the condition |
| θ (theta) band | = EEG data in the frequency band from 4 up to 8 Hz |