- Home
- About Journals
-
Information for Authors/ReviewersEditorial Policies
Publication Fee
Publication Cycle - Process Flowchart
Online Manuscript Submission and Tracking System
Publishing Ethics and Rectitude
Authorship
Author Benefits
Reviewer Guidelines
Guest Editor Guidelines
Peer Review Workflow
Quick Track Option
Copyediting Services
Bentham Open Membership
Bentham Open Advisory Board
Archiving Policies
Fabricating and Stating False Information
Post Publication Discussions and Corrections
Editorial Management
Advertise With Us
Funding Agencies
Rate List
Kudos
General FAQs
Special Fee Waivers and Discounts
- Contact
- Help
- About Us
- Search


The Open Fuels & Energy Science Journal
(Discontinued)
ISSN: 1876-973X ― Volume 11, 2018
Study on the Flow Characteristics of Shengli Oilfield Super Heavy Oil
Wang Shou-long, Li Ai-fen*, Peng Rui-gang, Yu Miao, Fu Shuai-shi
Abstract
Objective:
The rheological properties of oil severely affect the determination of percolation theory, development program, production technology and oil-gathering and transferring process, especially for super heavy oil reservoirs. This paper illustrated the basic seepage morphology of super heavy oil in micro pores based on its rheological characteristics.
Methods:
The non-linear flow law and start-up pressure gradient of super heavy oil under irreducible water saturation at different temperatures were performed with different permeable sand packs. Meanwhile, the empirical formulas between start-up pressure gradient, the parameters describing the velocity-pressure drop curve and the ratio of gas permeability of a core to fluid viscosity were established.
Results:
The results demonstrate that temperature and core permeability have significant effect on the non-linear flow characteristics of super heavy oil. The relationship between start-up pressure gradient of oil, the parameters representing the velocity-pressure drop curve and the ratio of core permeability to fluid viscosity could be described as a power function.
Conclusion:
Above all, the quantitative description of the seepage law of super heavy oil reservoir was proposed in this paper, and finally the empirical diagram for determining the minimum and maximum start-up pressure of heavy oil with different viscosity in different permeable formations was obtained.
Article Information

Identifiers and Pagination:
Year: 2017Volume: 10
First Page: 69
Last Page: 78
Publisher Id: TOEFJ-10-69
DOI: 10.2174/1876973X01710010069
Article History:
Received Date: 30/11/2016Revision Received Date: 27/1/2017
Acceptance Date: 12/2/2017
Electronic publication date: 30/09/2017
Collection year: 2017
open-access license: This is an open access article distributed under the terms of the Creative Commons Attribution 4.0 International Public License (CC-BY 4.0), a copy of which is available at: https://creativecommons.org/licenses/by/4.0/legalcode. This license permits unrestricted use, distribution, and reproduction in any medium, provided the original author and source are credited.
* Address correspondence to this author at the School of Petroleum Engineering, China University of Petroleum (East China), Qingdao, 266580, China; Tel: 086-0532-86981163; Fax: 086-0532-86981163; E-mail: aifenli@upc.edu.cn
| Open Peer Review Details | |||
|---|---|---|---|
| Manuscript submitted on 30-11-2016 |
Original Manuscript | Study on the Flow Characteristics of Shengli Oilfield Super Heavy Oil | |
1. INTRODUCTION
Heavy oil is a strategic source of hydrocarbons as the reserves are of the same order of magnitude as that of the conventional oil. However, the incredible low production and enormous challenge in transporting the heavy oil contrasts with the increase demand obviously, especially because of their very high viscosity and special flow characteristics in the porous media. To determine how to improve the current development technology and enhance the heavy oil recovery, knowledge of rheology and flow characteristic of heavy oil are required.
The rheology of oil has been studied by many researchers in order to design and operate heavy oil production systems efficiently. Regarding pressure, temperature and emulsion stabilities, a number of experiments with live-oil and dry oil samples were conducted to test the oil viscosity under different conditions and obtain the inversion point. The measured viscosities varied with temperature while it kept constant within the range of tested flow rates, suggesting that fluids were Newton. With more comprehensive study on emulsion rheology, the effect of emulsion viscosity on the multiphase flow of the produced stream was investigated [1Oliveira, R.C.G; Gonalves, M.A. Emulsion rheology-theory vs. field observation. Offshore Technology Conference, Houston, Texas, USA, May 2-5, 2005, 2Alboudwarej, H.; Muhammad, M.; Shahraki, A.K. Rheology of heavy-Oil emulsions. SPE Prod. Oper., 2007, 22(3), 285-293.
[http://dx.doi.org/10.2118/97886-PA] ]. Besides, to understand the rheology of heavy crude oil better, the presence of polar material such as asphaltene and resin in heavy oil was also studied in detail [3Argillier, J.F.; Coustet, C.; Henaut, I. Heavy Oil rheology as a function of asphaltene and resin content and temperature, SPE International thermal operations and heavy oil symposium and international horizontal well technology conference, Calgary, Alberta, Canada, November 4-7, 2002.-5Ghanavati, M.; Ahmad, R.S.; Hemmatisarapardeh, A. Experimental measurement and modeling of heavy crude oil rheological behavior: The roles of asphaltene fraction, shear rate, and temperature. J. Dispers. Sci. Technol., 2014, 17(2), 401-414.].
The non-Newtonian behavior of heavy crude oil is a well-known phenomenon, which has been the studying focus in the reservoir engineering for a long time [6Ghloum, E.F.; Rashed, A.M.; Al-Attar, M.A. Characteristics and inversion point of heavy crude oil emulsions in Kuwait. SPE Middle East Oil & Gas Show and Conference, Manama, Bahrain, March 8-11, 2015.-9Chhabra, R.P.; Richardson, J.F. Non-Newtonian flow and applied rheology: engineering applications. 2nd ed. Oxford: Butterworth-Heinemann, 2008.]. Considering the inertial losses, the law for the flow of viscous plastic fluids in porous media was established [10Kadet, V; Polonsky, D. Percolation modelling and non-newtonian flows in oil reservoirs. Latin American and Caribbean Petroleum Engineering Conference. Rio de Janeiro, Brazil, Aug 30- Sept 3, 1997.]. The common relation between flow rate and pressure drop which was used for different simulations of heavy oil recovery in real reservoirs was obtained. Furthermore, exhaustive research on the relations among start-up pressure gradient of heavy oil, the parameter describing velocity-pressure drop curve and the ratio of permeability measured with gas to fluids viscosity [11Wen-guang, F.E.; Jia-li, G.E. An unsteady non-Darcy flow problem at low speed in single medium, dual media. Pet. Explor. Dev., 1985, 2(1), 56-67.-14Zi-qiang, W.A.; Dai-yan, Z.H.; Jun, Y.A. Experimental study on percolation characteristics of ordinary heavy oil. Oil Gas Geol., 2012, 33(2), 302-306.] has been shown in the previous studies. But few studies have been conducted for super heavy oil, let alone that on the rheological behavior of the oil.
The objective of this paper is to study on the flow characteristics of super heavy oil in the porous media based on its rheological behavior at different temperatures, such as start-up pressure gradient and velocity-pressure drop curve. To acquire the diagram for determining the minimum and maximum start-up pressure with different oil viscosities in different reservoirs, regression analysis on experimental results was accomplished necessarily.
2. STUDY ON THE RHEOLOGY OF SUPER HEAVY OIL
Theoretical Analysis Rheology describes the relationship between shear rate and shear stress for fluid flow, which can be applied to determine the fluid type. Considering the importance of rheology utilized in various aspects, capillary model shown in Fig. (1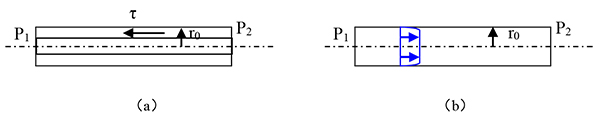 ) was adopted to analyze the rheological mechanism.
 |
Fig. (1) Capillary Model. |
2.1. Flow Characteristic of Bingham Fluid in Single Capillary
For the impressed pressure is equal to the friction of fluid flows in the capillary
 |
(1) |
where r is the radius of the capillary;
τ is yield stress.
Under the same pressure gradient, the shear stress increases with distance from capillary center. The value of shear stress on the capillary wall is
 . Besides, fluids begin to flow in the capillary only when τw is larger than τ 0. And mobile fluids will increase with the increase of pressure gradient in the capillary.
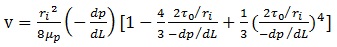
2.2. Flow Rate
There is no shear stress within the radius range of rp in the capillary,
 |
(2) |
The shape of velocity distribution in capillary shown in Fig. (1a) is like a paraboloid. This means velocity in single capillary can be derived from (Fig. 1b)
 |
(3) |
The start-up pressure can be calculated when the value of bracket mentioned above is zero.
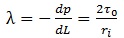 |
(4) |
where, λ is start-up pressure.
The mean velocity in capillary tube can be obtained by utilizing V = θv and K = θri2/8,
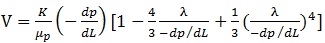 |
(5) |
2.3. Flow Characteristic of Bingham Fluid in Porous Media
It is generally known that the radius of capillary is inversely proportional to the value of minimum start-up pressure gradient and the velocity increases with the increase of pressure gradient in the same capillary. Presence of minimum start-up pressure can be found easily from Formula (5) when Bingham fluid flows in capillary. For the real reservoir, super heavy oil as a Bingham fluid is not able to flow in micro pores unless the pressure is larger than the minimum start-up pressure in the biggest capillary. And more fluid in smaller capillary is able to flow as the pressure gradient increases.
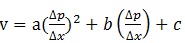
The math expressions of non-linear flow law for super heavy oil were established by regression analysis on many experimental results. And the formulas are as follows.
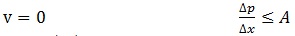 |
(6) |
 |
(7) |
 |
(8) |
where, v is fluid velocity, cm/min;
Δp/ Δx is impressed pressure gradient, MPa/cm;
A is the minimum start-up pressure gradient;
B is the threshold pressure, MPa/cm;
C is the maximum start-up pressure gradient;
µ is the fluid viscosity, mPa·s;
a, b, c are constant related with core permeability and fluid viscosity;
α,β respectively represent the slope and intercept of quasi linear.
In order to better divide the flow behavior for different stages in the real reservoir, such as non-linear flow, quasi-linear flow and Darcy flow, the velocity can be accurately calculated based on the formulas (6)-(8). Thus the parameters used in reservoir simulation will be real and effective.
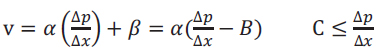
Oil Sample Analysis To better reflect the characteristic of super heavy oil, a comparison between super heavy oil and heavy oil that mainly includes four components, oil viscosity and density was performed, of which the results are shown in Table (1). It is much easier to be found that there is an obvious difference in four components, especially the content of resin and asphaltene, leading the increase of super heavy oil viscosity by several orders of magnitude. And this may also be used to explain the characteristic of the rheological behavior of super heavy oil. Then to determine the fluid type of super heavy oil in terms of its rheology, experiments to study the relationship between shear stress and shear rate are conducted at different temperatures, whose results are shown in Fig. (2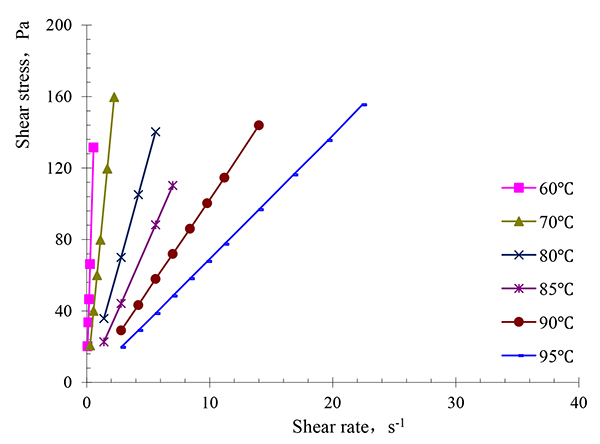 ).
).

It is observed from Fig. (2a) that the rheological curve of super heavy oil is a line disconnected with zero point, suggesting there is a certain yield stress. While Fig. (2b) shows that the lines pass through the origin. And the slope of these lines decreases as the temperature increases. To better understand the rheological behavior of different oils, the constitutive equations shown in Table (2) were derived by fitting rheological curves in Fig. (2). It can be easily found that the intercept of these lines with y-coordinate of super heavy oil decreases as the temperature increases until reaching 95°C, at which it can be taken as the inversion point for fluid becoming Newton. And the super heavy oil can be identified as Bingham fluid, for yield stress decreases with the increase in temperature. However, the heavy oil studied in this paper is Newton fluid when the temperature is higher than 60°C.

 |
Fig. (2) Rheological curves of super heavy oil from Shengli Oilfield at different temperatures. |
3. STUDY ON FLOW CHARACTERISTIC OF SUPER HEAVY OIL
Experimental Preparation and Method: The super heavy oil from Shengli Oilfield and formation water with 9569.64mg/L salinity were used in this paper. Steady state method and the capillary equilibrium method were applied to measure velocity-pressure drop curve and the start-up pressure of oil. The experimental flow chart is shown in Fig. (3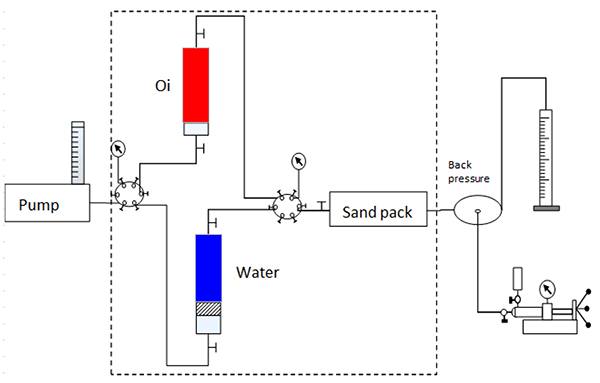 ).
).
The dotted line in the chart represents the incubator. The sand pack was water flooded with ISCO pump (Teledyne USA ISCO-A260D) at a certain flow rate and the pressure was recorded by computer after the system reached steadiness. Then conditions changed such as flow rate, temperature and sand pack permeability to obtain velocity-pressure drop curves.
 |
Fig. (3) Experimental flow chart. |
4. EXPERIMENTAL RESULTS AND ANALYSIS
4.1. Velocity-Pressure Drop Curve at Swc
The velocity-pressure drop curves were conducted with cores of different permeabilities(8000×10-3μm2, 2000×10-3μm2, 450×10-3μm2) at different temperatures (60°C ,80°C, 110°C ,140°C); the results are shown in Fig. (4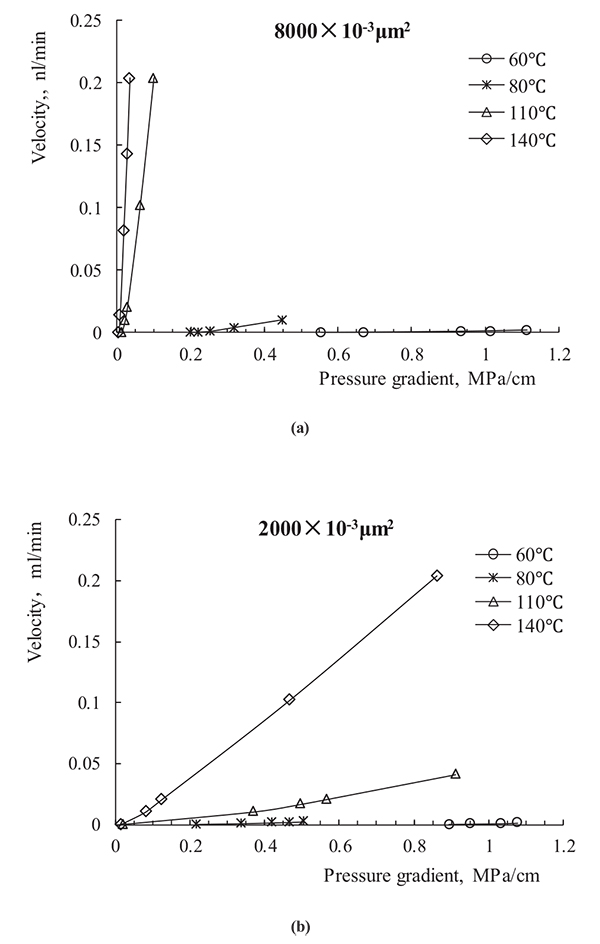 ).
).
For different permeable cores under less pressure gradient, the velocity can be expressed as
 and a concave-down non-linear segment emerges in the velocity-pressure drop curve. However, as pressure gradient increases to a certain value, the velocity-pressure drop curve appears as a line, where velocity can be expressed as V =
 Compared with the low permeability cores, the velocity-pressure drop curves of high permeability cores are of bigger slopes and shorter nonlinear segments. Besides, temperature has crucial influence on the length of non-linear segment, because of the decrease of percolation resistance and especially the sharp reduction of oil viscosity with temperature. Above all, both temperature and permeability have an obvious effect on the flow of super heavy oil.
 |
Fig. (4) Velocity-pressure drop curves with different permeable sand packs at different temperatures. |
4.2. Minimum Start-up Pressure Gradient of Oil at Swc
The result in Fig. (5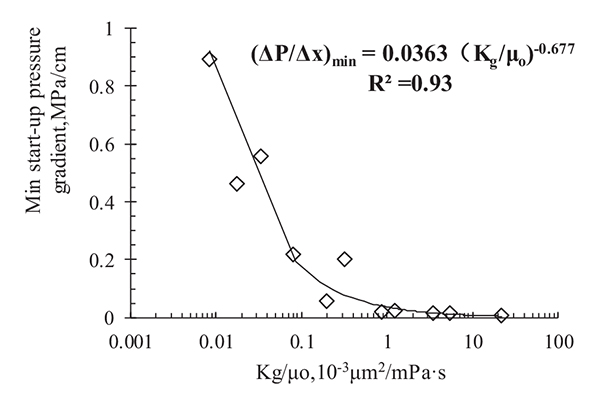 ) demonstrates that the relationship between minimum start-up pressure gradient and kg/μ o could be described as a power function, of which the correlation coefficient reaches to 93%. And the minimum start-up pressure gradient of oil has an inverse correlation to kg/μo when its value is less than 0.1×10⁻³×μm2/(mPa.s).
According to Formula (8), the threshold pressure can be expressed as,
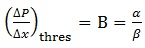 |
(9) |
In order to make the derivative value to the pressure gradient of formula (7) and (8) equal, formula (10) can be deduced, based on the fact that the slope of linear and nonlinear segments of velocity-pressure drop curve is the same at the maximum start-up pressure gradient.
 |
(10) |
The maximum start-up pressure gradient is
 |
(11) |
Overall, both threshold pressure and the maximum start-up pressure gradient have a good correlation with kg/μo, whose correlation also presents as a power function; the results are shown in Figs. (6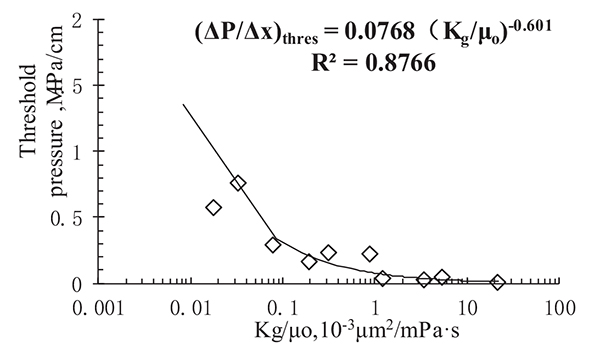 ) and (7
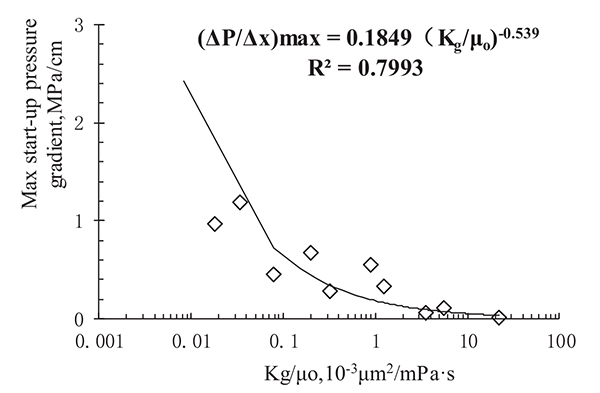 ), respectively. Besides, the experimental data of start-up pressure gradient are listed in Table 3.
 |
Fig. (5) Relationship between minimum start-up pressure gradient and kg/µo. |

 |
Fig. (6) Relationship between threshold pressure and kg/µo. |
 |
Fig. (7) Relationship between maximum start-up pressure gradient and kg/µo. |
4.3. Regression Analysis on Experimental Result
According to formula (6)~(8), both groups of the parameters including a, b and c used to describe the nonlinear segment and α , β representing the linear segment are able to be obtained by fitting the non-linear and linear curve with quadratic function and linear function, of which the results are shown in Table 4.


4.4. Start-up Pressure Diagram for Super Heavy Oil
The theoretical template for determining the minimum and maximum start-up pressure gradient of super heavy oil is diagrammed in Fig. (8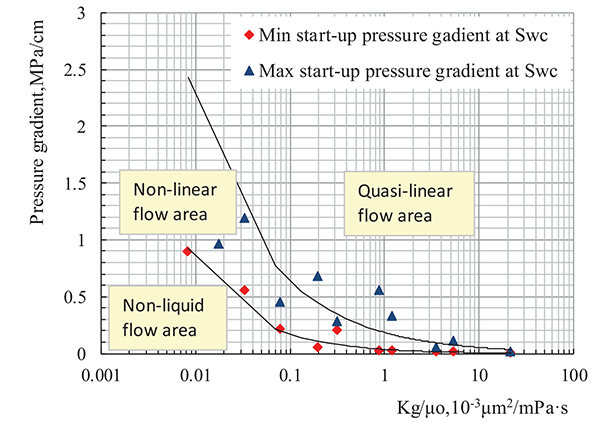 ). And the flow area of reservoir can be divided into three parts: quasi-linear, non-linear and non-liquid parts, considering the decrease of pressure gradient along the distance from the well bottom. Incidentally, the difference between minimum and maximum start-up pressure gradient decreases with the increase of Kg/µ0 , which implies that the non-linear segment gets shorter with higher core permeability and lower oil viscosity.
 |
Fig. (8) Diagram for determining the min and max start-up pressure gradient of super heavy oil in different permeable reservoirs. |
CONCLUSION
- Both permeability and temperature have significant impact on the flow of super heavy oil. And the relationship between velocity and pressure gradient in different stages was established in this paper.
- The value of kg/μo has an inverse correlation with the percolation resistance, suggesting that the surface of solid has some influence on boundary layer fluids. And the relationship between kg/μo and the minimum, threshold and maximum start-up pressure gradient was described as a power function.
- The mathematical expressions for describing the relationship between kg/μo and the minimum, threshold and maximum start-up pressure gradient of super heavy oil were first proposed in this paper. And the diagrams for the minimum and maximum start-up pressure gradient of super heavy oil in different permeable reservoirs were also obtained.
CONSENT FOR PUBLICATION
Not applicable.
CONFLICT OF INTEREST
The authors declare no conflict of interest, financial or otherwise.
ACKNOWLEDGEMENTS
The authors would like to thank the fund by National Natural Science Foundation of China (51274226, 2013-2016) and Natural Science Foundation of Shandong Province (ZR2014EL017). Meanwhile, we would like to appreciate the help provided by our research group in conducting various experiments.
REFERENCES
| [1] | Oliveira, R.C.G; Gonalves, M.A. Emulsion rheology-theory vs. field observation. Offshore Technology Conference, Houston, Texas, USA, May 2-5, 2005 |
| [2] | Alboudwarej, H.; Muhammad, M.; Shahraki, A.K. Rheology of heavy-Oil emulsions. SPE Prod. Oper., 2007, 22(3), 285-293. [http://dx.doi.org/10.2118/97886-PA] |
| [3] | Argillier, J.F.; Coustet, C.; Henaut, I. Heavy Oil rheology as a function of asphaltene and resin content and temperature, SPE International thermal operations and heavy oil symposium and international horizontal well technology conference, Calgary, Alberta, Canada, November 4-7, 2002. |
| [4] | Kumar, R.; Banerjee, S.; Kumar, N. Comparative studies on synthetic and naturally extracted surfactant for improving rheology of heavy crude oil. Petrol. Sci. Technol., 2015, 33(10), 1101-1109. |
| [5] | Ghanavati, M.; Ahmad, R.S.; Hemmatisarapardeh, A. Experimental measurement and modeling of heavy crude oil rheological behavior: The roles of asphaltene fraction, shear rate, and temperature. J. Dispers. Sci. Technol., 2014, 17(2), 401-414. |
| [6] | Ghloum, E.F.; Rashed, A.M.; Al-Attar, M.A. Characteristics and inversion point of heavy crude oil emulsions in Kuwait. SPE Middle East Oil & Gas Show and Conference, Manama, Bahrain, March 8-11, 2015. |
| [7] | Taborda, E.A.; Franco, C.A.; Lopera, S.H. Effect of nanoparticles/nanofluids on the rheology of heavy crude oil and its mobility on porous media at reservoir conditions. Fuel, 2016, 184, 222-232. |
| [8] | Huang, Z.Q.; Jiang, G.A.; Zheng, S.J.; Wang, W.Y.; Yue, Q.S. The key drilling technique of formation protection for coal-bed methane. J. Oil Gas Technol., 2010, 32(6), 116-118. |
| [9] | Chhabra, R.P.; Richardson, J.F. Non-Newtonian flow and applied rheology: engineering applications. 2nd ed. Oxford: Butterworth-Heinemann, 2008. |
| [10] | Kadet, V; Polonsky, D. Percolation modelling and non-newtonian flows in oil reservoirs. Latin American and Caribbean Petroleum Engineering Conference. Rio de Janeiro, Brazil, Aug 30- Sept 3, 1997. |
| [11] | Wen-guang, F.E.; Jia-li, G.E. An unsteady non-Darcy flow problem at low speed in single medium, dual media. Pet. Explor. Dev., 1985, 2(1), 56-67. |
| [12] | Naiya, T.K.; Banerjee, S.; Kumar, R. Heavy crude oil rheology improvement using naturally extracted surfactant. SPE Oil & Gas India Conference and Exhibition, Mumbai, India, November 24-26, 2015. |
| [13] | Ji, T.I; Jia-feng, X.U; Lin-song, C.H The method of characterization and physical simulation of TPG for ordinary heavy oil. J. Southwest Pet. Univ., 2009, 31(3), 158-162. |
| [14] | Zi-qiang, W.A.; Dai-yan, Z.H.; Jun, Y.A. Experimental study on percolation characteristics of ordinary heavy oil. Oil Gas Geol., 2012, 33(2), 302-306. |