- Home
- About Journals
-
Information for Authors/ReviewersEditorial Policies
Publication Fee
Publication Cycle - Process Flowchart
Online Manuscript Submission and Tracking System
Publishing Ethics and Rectitude
Authorship
Author Benefits
Reviewer Guidelines
Guest Editor Guidelines
Peer Review Workflow
Quick Track Option
Copyediting Services
Bentham Open Membership
Bentham Open Advisory Board
Archiving Policies
Fabricating and Stating False Information
Post Publication Discussions and Corrections
Editorial Management
Advertise With Us
Funding Agencies
Rate List
Kudos
General FAQs
Special Fee Waivers and Discounts
- Contact
- Help
- About Us
- Search


The Open Medical Informatics Journal
(Discontinued)
ISSN: 1874-4311 ― Volume 13, 2019
Patient-Specific Volume Conductor Modeling for Non-Invasive Imaging of Cardiac Electrophysiology
B Pfeifer*, §, 1, F Hanser§, 2, M Seger1, G Fischer1, R Modre-Osprian3, B Tilg1
Abstract
We propose a general workflow to numerically estimate the spread of electrical excitation in the patients’ hearts. To this end, a semi-automatic segmentation pipeline for extracting the volume conductor model of structurally normal hearts is presented. The cardiac electrical source imaging technique aims to provide information about the spread of electrical excitation in order to assist the cardiologist in developing strategies for the treatment of cardiac arrhythmias. The volume conductor models of eight patients were extracted from cine-gated short-axis magnetic resonance imaging (MRI) data. The non-invasive estimation of electrical excitation was compared with the CARTO™ maps. The development of a volume conductor modeling pipeline for constructing a patient-specific volume conductor model in a fast and accurate way is one essential step to make the technique clinically applicable.
Article Information
Identifiers and Pagination:
Year: 2008Volume: 2
First Page: 32
Last Page: 41
Publisher Id: TOMINFOJ-2-32
DOI: 10.2174/1874431100802010032
Article History:
Received Date: 9/1/2008Revision Received Date: 29/1/2008
Acceptance Date: 24/2/2008
Electronic publication date: 13/3/2008
Collection year: 2008
open-access license: This is an open access article licensed under the terms of the Creative Commons Attribution Non-Commercial License (http://creativecommons.org/licenses/by-nc/3.0/) which permits unrestricted, non-commercial use, distribution and reproduction in any medium, provided the work is properly cited.
* Address correspondence to this author at the Institute of Biomedical Signal Processing and Imaging, University for Health Sciences, Medical Informatics and Technology (UMIT), Eduard-Wallnöfer-Zentrum 6060, Hall in Triol, Austria; Email: bernhard.pfeifer@umit.at§ These authors contributed equally.
| Open Peer Review Details | |||
|---|---|---|---|
| Manuscript submitted on 9-1-2008 |
Original Manuscript | Patient-Specific Volume Conductor Modeling for Non-Invasive Imaging of Cardiac Electrophysiology | |
1. INTRODUCTION
Computer modeling of bioelectric activity is of interest in cardiac electrophysiology [1Gulrajani RM, Geselowitz DB. Models of the electrical activity of the heart and computer simulation of the electrocardiogram Crit Rev Biomed Eng 1988; 16: 1-66.-3Modre R, Tilg B, Fischer G, Wach P. An iterative algorithm for myocardial activation time imaging Comput Methods Programs Biomed 2001; 64: 1-7.] and, furthermore, the non-invasive imaging of the electrical excitation from electrocardiogram (ECG) has become a diagnosis tool in clinical applications [4Ramanathan C, Ghanem R, Jia P, Ryu K, Rudy Y. Noninvasive electrocardiographic imaging for cardiac electrophysiology and arrhythmia Nat Med 2004; 10(4): 422-28., 5Modre R, Tilg B, Fischer G, et al. Atrial noninvasive activation mapping of paced rhythm data J Cardiovasc Electrophysiol 2003; 14(7): 712-19.]. For non-invasive imaging of the electrical function four dimensional (3D and time) anatomical and ECG mapping data have to be combined. This enables the computation of the electrocardiographic inverse problem, which is commonly referred to as the estimation of the source from measured fields. The anatomical data are obtained via magnetic resonance imaging (MRI). These volume data provide the basis for generating a patient-specific volume conductor model (VCM). In order to solve the inverse problem for imaging the electrical excitation a VCM is needed. A VCM comprises the electrically most active compartments: chest surface, lung surface, atrial and ventricular myocardium and the cardiac blood masses [6Bradley C, Pullan A, Hunter P. Effects of material properties and geometry on electrocardiographic forward simulations Ann Biomed Eng 2000; 28(7): 721-41.]. The ECG mapping data are acquired with a multi-channel ECG recording system [7Metting van Rijn AC, Peper A, Grimbergen CA. High quality recording of bioelectric events. Part 1. Interference reduction, theory and practice Med Biol Eng Comput 1990; 28(5): 389-97., 8Metting van Rijn AC, Peper A, Grimbergen CA. High quality recording of bioelectric events.Part 2. Low-noise, low-power multichannel amplifier design Med Biol Eng Comput 1991; 29(4): 433-0.]. In the electrocardiographic inverse problem, the electrical source distribution is reconstructed from body surface maps by employing an electrical source-model description. Because of the generally unknown individual cardiac fiber orientation, electrical isotropy is assumed in the surface heart model approach based on the bidomain theory [9Greensite F. The mathematical basis for imaging cardiac electrical function Crit Rev Biomed Eng 1994; 22: 347-99.-11Tilg B, Fischer G, Modre R, et al. Model-based imaging of cardiac electrical excitation in humans IEEE Trans Med Imaging 2002; 21(9): 1031-39.].
The cardiac electrical source imaging technique provides information about the spread of electrical excitation in order to assist the cardiologist in developing strategies for treatment of cardiac arrhythmias. In many cases it is possible to trace back common cardiac arrhythmias to accessory pathways, atrial or ventricular foci, e.g., from the pulmonary veins [12Haissaguerre M, Jais P, Shah DC, et al. Spontaneous initiation of atrial fibrillation by ectopic beats originating from the pulmonary veins N Engl J Med 1998; 339(10): 659-6.], and reentrant circuits [13Vigmond EJ, Ruckdeschel R, Trayanova NA. Reentry in a morphologically realistic atrial model J Cardiovasc Electrophysiol 2001; 12(9): 1046-54.]. Identifying the site of origin of the ectopic focus or the location of an accessory pathway provides essential information for treatment strategies, like catheter ablation [14Morady F. Radio-frequency ablation as treatment for cardiac arrhythmias N Engl J Med 1999; 340(7): 534-44.].
In clinical practice the localization of ectopic origins is currently achieved by traditional catheter techniques and by recently introduced catheter mapping systems, like the CARTO™ system [15Andrea E, Atie J, Maciel W, et al. Mapping of supraventricular tachycardias by using a new tridimensional technology — The CARTO system J Electrocardiol 2001; 34(4): 334.]. The major advantage of the CARTO™ system is that it enables the combination between electrical and spatial endocardial information, which supports the cardiologist in getting a deeper insight in the patients’ arrhythmias. CARTO™ provides electro-anatomical information that assists the cardiologist in applying linear lesions. CARTO™ shows significant limitations when it comes to acquiring single-beat activation maps and, furthermore, these are mostly applied to single target chambers only. Another important fact is that it is impossible to obtain information from the epicardium under clinical conditions. Moreover, this invasive technique imposes a higher risk to the patient during the procedure. These limitations can be bypassed by providing the electrical excitation non-invasively, by applying the non-invasive imaging of cardiac electrophysiology (NICE) approach. The goal was the development of a modeling pipeline that enables our approach to become clinically applicable.
2. NON-INVASIVE CARDIAC IMAGING WORKFLOW
To enable non-invasive cardiac imaging a modus operandi was defined that needs to be followed in order to process the pipeline. In the first modeling step the anatomy of the patient has to be acquired. This is performed by MRI using a Magnetom-Vision-Plus 1.5 T (Siemens Medical Solutions) scanner. The atrial and ventricular geometry is recorded in CINE-mode during breath-hold (expiration, short-axis scans, 4-6 mm spacing). The shape of the lungs and the torso are recorded in T1-FLASH-mode during breath-hold (expiration, long-axis scans, 10 mm spacing). For locating and coupling the mapping electrodes vitamin E capsules were used, because these markers are clearly visible in the MRI images and can be easily identified. Seven markers (anatomical landmarks on the anterior and lateral chest wall) were used to couple the locations of the electrodes to the MRI frame. Eleven capsules were attached on the back, in order to tag the positions of the posterior electrodes, which were not accessible during the electrophysiology study (EPS). The positions of the anterior and lateral electrodes were digitized using the Fastrak system (Polhemus Inc.). Additionally, the locations of the 7 anatomical landmarks were digitized in order to allow transformation into the MRI frame. A VCM with visualized electrode positions using spheres is depicted in Fig. (1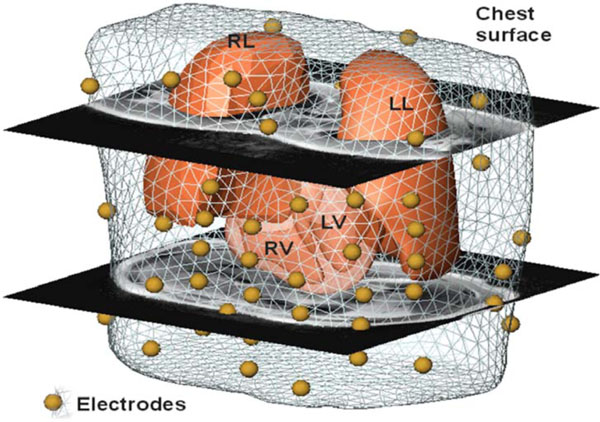 ).
).

The next step is the volume conductor modeling task using two volume data sets. The short-axis data is used for the cardiac modeling of the blood masses, the ventricles’ myocardium and the atria. The axial data set is used for modeling the lung and chest surfaces. When the extraction procedure is finished the compartments are coupled together to the so-called volume conductor model. This modeling part needs to be done in a short time period because the time between the MRI procedure and the catheter intervention is normally limited by two hours.
The third step is accomplished in the catheter laboratory and is known as EPS. The electrical recordings from different locations in the heart and the response to electrical stimulation via the wires allow detailed information about the cause of the palpitations to be identified. The EPS is a diagnostic procedure to obtain a reading of the impulses, which cause irregular heart beats from the interior of the heart. If the diseased location is found the cardiologist medicates via ablation [14Morady F. Radio-frequency ablation as treatment for cardiac arrhythmias N Engl J Med 1999; 340(7): 534-44.]. When estimating the electrical excitation a multi-lead ECG is derived from the patients’ body surface. The derived ECG signals are then pre-filtered and baseline corrected. With this initial estimation the cardiologist is able to find the location of the accessory pathway by using the standard mapping system CARTO™ (Biosense Webster Inc.) and disconnects the pathway by ablation [14Morady F. Radio-frequency ablation as treatment for cardiac arrhythmias N Engl J Med 1999; 340(7): 534-44.].
After this procedure the accessory pathways location is estimated (in case of e.g., Wolff-Parkinson-White (WPW) Syndrome) using the NICE [3Modre R, Tilg B, Fischer G, Wach P. An iterative algorithm for myocardial activation time imaging Comput Methods Programs Biomed 2001; 64: 1-7., 10Modre R, Tilg B, Fischer G, Wach P. A noninvasive Myocardial Activation Time Imaging: A novel Inverse Algorithm applied to Clinical ECG Mapping Data IEEE Trans Biomed Eng 2002; 49(10): 1153-61., 11Tilg B, Fischer G, Modre R, et al. Model-based imaging of cardiac electrical excitation in humans IEEE Trans Med Imaging 2002; 21(9): 1031-39.] approach.
When the EPS study is finished all measured data of the NICE pipeline including the CARTO™maps are analyzed in order to validate the quality of the models and the non-invasive estimation of the electrical excitation in the human heart.
3. VOLUME CONDUCTOR MODEL
3.1. Functional Model
When trying to investigate how anatomical models of different tissue compartments get extracted a quantum of publications can be found. When tackling the problem of estimating the electrical spread in the heart the situation of building a model differs from the anatomical model extraction approach. Fine anatomical structures don’t influence the electrical properties of a volume conductor model because of the smoothing properties of the Fredholm integral which describes the relationship between the source points in the heart (transmembrane potential distribution according to bidomain theory) and the potentials on the chest surface. Therefore, these fine anatomical structures can be smoothed out without decreasing the model’s accuracy. Moreover, from a numerical point of view, fine anatomical structures give rise for degenerated triangles, which may cause numerical instability when performing the estimation of the electrical spread.
In summary, the resolution is influenced by
- the ill-posedness of the inverse problem,
- the image modalities (slice thickness of 4 to 10 mm),
- the smoothing properties of the integral,
and, for these reasons, advancing the discretization does not improve the quality of the results.
3.2. Electrically Active Compartments
To create a volume conductor model in order to estimate the electrical spread in the human heart, the decision of the active compartments needs to be done [6Bradley C, Pullan A, Hunter P. Effects of material properties and geometry on electrocardiographic forward simulations Ann Biomed Eng 2000; 28(7): 721-41.]. The volume conductor model comprises the electrically most active compartments. For our model these compartments are:
- chest (medium conductivity, surface electrodes),
- lungs (low conductivity, filled with air),
- atrial and ventricular blood masses (high conductivity),
- atrial and ventricular myocardium (medium conductivity, electrical sources).
Fig. (2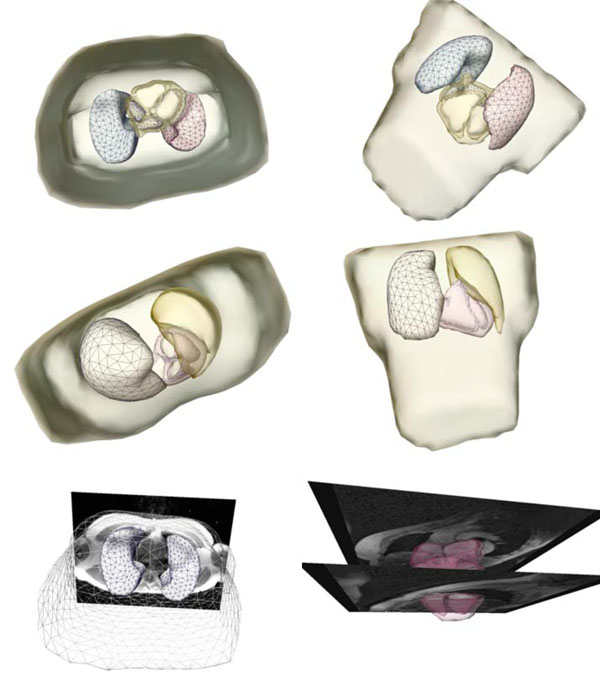 ) shows a patient-specific volume conductor model in different perspectives.
 |
Fig. (2) Extracted and triangulated patient-specific volume conductor model in different perspectives. The figures in the last row show the model superimposed onto the MRI volume data. |
4. SEGMENTATION PIPELINE
4.1. General
As a result of the variety of the different compartments, the volume conductor model requires different compartment-specific approaches, which had to be developed. The reason is that there is no uniform segmentation approach capable of extracting different compartments. Furthermore, there are two pre-processed data sets (short-axis, axial) to handle the modeling task. These compartment-specific steps can be executed sequentially, and, in a more global view, the compartments can also be extracted using a pipeline.
To have a homogeneous and clinically applicable software the Medical Segmentation Toolkit (MST) is used. MST enables an easy integration of different state-of-the-art frameworks and segmentation methods. The framework enables an easy development of segmentation pipelines to extract different compartments semiautomatically after initial parameter settings. A detailed explanation is given in [16Pfeifer B, Hanser F, Seger M. A C++ Framework for creating tissue specific segmentation-pipelines In: Galloway Jr RL, Cleary KR, Eds. Medical Imaging 2005: Visualization, Image-Guided Procedures, and Display, Volume 5744 of Proc of SPIE In Medical Imaging 2005: Visualiztion. 2005; pp. 317-28. SPIE - The International Society for Optical Engineering].
4.2. Chest Extraction
The chest can be segmented quite simply using a seeded region growing algorithm [17Adams R, Bischof L. Seeded Region Growing IEEE Trans Pattern Anal Mach Intell 1994; 16(6): 641-47.]. The result of this segmentation approach, with the seed point at a voxel outside the torso boundary, is the surrounding volume of the chest. To get the chest volume as needed, the segmentation result has to be inverted. After this a smoothing needs to be done in order to get an accurate chest model. Although the above described approach is trivial and elegant it does not fulfill our conditions completely. Therefore, a more specific method was created to extract a homogenous and symmetric chest model with the arms cut of at an initial position. This position is placed where the arms no longer touch the torso. Furthermore, both arms have to be cut off at the same slide (position) in the image data to get a symmetric chest model.
First of all the image data are prefiltered by a Roberts Cross function [18Roberts LG. Machine Perception of 3-D Solids In: Optical and Electro-optical Information Processing. MIT press 1965; pp. 159-97.]. It highlights regions of high spatial gradient measurements, which corresponds to edges. A big advantage of the Roberts Cross function is that no parameters need to be set and it can be computed quickly because only four input voxels have to be examined to compute the new output values of the image. Because of the small input mask, the Robert Cross filter is sensitive to noise, but in our case this is not crucial because we are only interested in the outer boundary of the chest.
In the next step the algorithm searches the position of the image where the chest’s border appear for the first time. This row position is the starting vector for extracting the chest and separating the arms. Therefore, on the most left and most right voxel of the initial position a beam with a 45 degree angle is projected to the chests border. After this projection the left beam tries to reach the last row of the image by following the left border of the chest. The left image in Fig. (3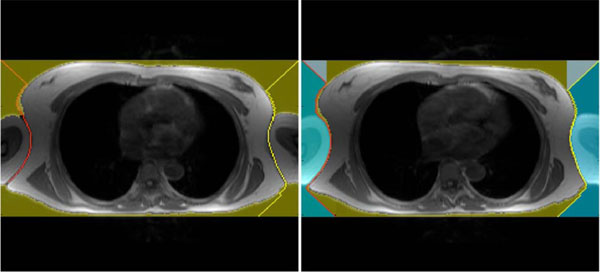 ) shows an example where the algorithm was able to separate only one arm, which means that both arms remain part of the model. The right image in Fig. (3) shows the algorithm succeeding in separating both arms. From now on, the arms are separated and cut off in the model. Although this separating procedure is not crucial for our estimation of the electrical excitation in the human heart approach, it helps generate symmetric models.

4.3. Lung Extraction
The advantage when trying to segment the lungs is that the gray values differ intensely from the surrounding tissue. Although the extraction approach seems to be simple another problem arises: the left and the right lungs are often in immediate contact. The left and the right lungs are, however, needed as separated compartments, and, therefore, the segmentation process needs to take care of this problem. The method described in [19Kuhnigk JM, Hahn HK, Hindennach M, Dicken V, Krass S, Peitgen HO. Lung lobe segmentation by anatomy-guided 3D watershed transform In: Sonka M, Fitzpatrick JM, Eds. Medical Imaging 2003: Image Processing, Volume 5032 of Proc of SPIE. 2003; pp. 1482-90. SPIE - The International Society for Optical Engineering] yields good results but requires user input. For extracting a rather good representation of the lungs without manual interaction the algorithm described in [20Müller H, Marquis S, Cohen G, Lovis C, Geissbuhler A. Lung CT Analysis and Retrieval as a Diagnostic Aid In: Engelbrech R, Geissbuhler A, Lovis C, Mihalas G, Eds. Studies in Health Technology and Informatics, Volume 116 of Proc of MIE2005 - The XIXth International Congress of the European Federation for Medical Informatics. Netherlands: Nieuwe Hemweg 6B 1013 BG Amsterdam. The Netherlands IOS Press 2005; pp. 453-58.] can be used. In principal, the image is thresholded to separate the lungs from surrounding fat, then the chest-surrounding air, noise and airways are removed, a rolling-ball operator can be used to rebuild the lung borders, and, as a last step, the left and the right lungs are separated and identified by a connected component labeling.
4.4. Atrial and Ventricular Blood Mass Extraction
The blood masses are highly electrically active and, furthermore, the blood masses provide the a-priori information for the myocardium reconstruction process. On the basis that Active Appearance Models (AAMs) have been shown to be useful for interpreting deformable objects, this technique was chosen to extract the cardiac blood masses [21Cootes T, Edwards GJ, Taylor CJ. Active appearance models In: Burkhardt H, Neumann B, Springer Verlag, Eds. Volume 2 In: 5th European Conference on Computer Vision; 1998; pp. : 484-98., 22Edwards GJ, Taylor CJ, Cootes TF. Interpreting face images using active appearance models IEEE Pervasive Comput. In: FG '98: Proc. of the 3rd. International Conference on Face & Gesture Recognition; Washington DC USA. 1998; pp. 300-05.]. AAMs are generative models capable of synthesizing images of a given object class. AAMs contain statistical models of shape and gray level appearance of objects. AAMs can also be used to fit the model in an unseen image, and, therefore, be applied to determine the target structure in the input image.
For extracting an object using AAMs training sets have to be created. The target structure or shape needs to be marked in these training sets using corresponding landmark points. A shape is described by a set of n points that can formally be described as a vector
The creation of s training samples means that s vectors have to be generated. Normally, a human expert annotates the training samples by identifying good landmark points. Such landmarks are points of high curvature or junctions. Because this procedure is a time-consuming and costly process, problem specific automatic landmark placement methods have been developed [23Cootes T, Taylor C. Statistical models of appearance for computer vision Technical report 2004. citeseer.ist.psu.edu/cootes04statistical.html] but our model was generated by placing the landmark points manually by an expert. Henceforth, it has to be guaranteed that all shapes are in the same coordinate frame to apply statistical analysis. Thus, the sum of squared distances of each shape to the mean value
The parameter vector c controls shape and texture,
An AAM seeks to minimize the difference between an unseen image and the ones created by the appearance model. Therefore a difference vector δI can be defined as
where Ii describes the vector of gray-level values in the image, and Im stands for the gray-level vector of the current model. To get the best match between an unseen model and one generated by the AAM, the magnitude difference vector has to be minimized
4.4.1. Ventricular Blood Mass Segmentation
For establishing the AAM 71 training sets (cine-gated, short-axis scans) were used. Every image set was annotated using 99 annotation points. These annotation points were grouped as follows: 33 points were used to specify the outer boundary of the left ventricular myocardium, 33 landmarks were used to describe the left ventricular blood mass, and the remaining 33 landmark points were used to describe the right ventricular blood mass. Although the specifying of the outer boundary is not mandatory, this description was made, firstly, to have a possibility to check the myocardium reconstruction accuracy and, secondly, to easily initialize the model’s search procedure.
The search procedure starts after mean model insertion in the image data. In a next step the mean model gets initialized, which means to locate the left and right ventricular blood masses best possible only by using the mean model information. After this procedure the starting vector for the AAM search is defined. From the time when the initialization is done, the model fit approach (AAM search) starts until the search converges. Because the likelihood that the adjacent images have a related shape and gray-level appearance the finding of the prior arranged search is used as starting vector in the adjacent images. This approach is repeated from apex cordis up to the base of the heart. The approach extracts the separated blood masses of the left and right ventricle, as shown in Fig. (4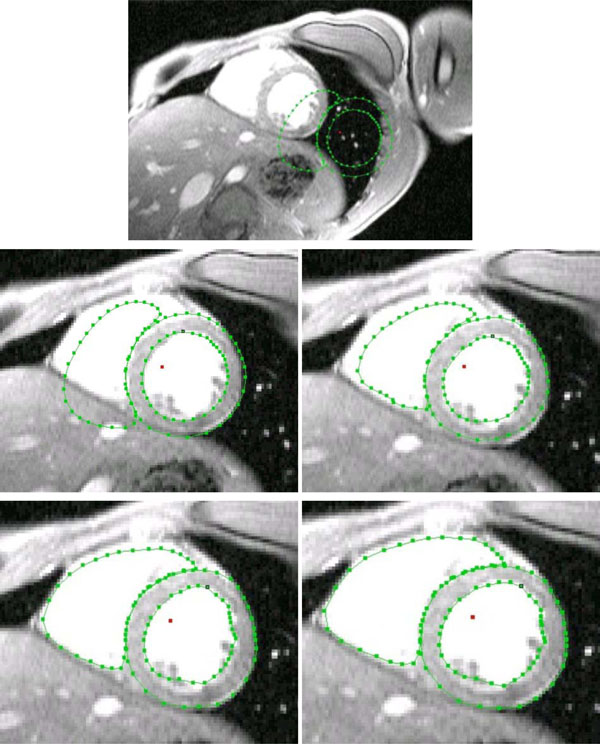 ).
).

4.4.2. Atrial Blood Mass Segmentation
Due to the more complex geometry of the atria in comparison to the ventricles the appearance models and the associated search procedure need to be handled in a different way. The orifices of the pulmonary veins, orifices of superior and inferior vena cava, tricuspid and mitral annuli, and right and left appendages give the complex geometry of the atria. Accordingly, a huge shape variation has to be dealt with. Three separate appearance models were created. The atria are divided into three divisions of appearance. The first division reaches from the base of the heart to the first appearance of the blood masses of the left upper (LUPV) and the left lower (LLPV) pulmonary vein. The second division continues from this position to the last appearance of the LUPV and LLPV blood masses, and the third division spans the region from there to the end of the appearance of the atria in the image stack. The end is defined by the last appearance of the right lower (RLPV) and right upper (RUPV) blood mass. The same divisions are used for the left atrium. This is done in order to extract the left and the right atrial blood mass with one and the same AAM, which helps reduce global complexity. Like the shape description method used for the ventricles, also 99 annotation points or landmarks were used to annotate 175 atrial training images (cine-gated, short-axis images). With 33 annotation points the left atrial blood mass is defined, with the following 33 points the right atrial blood mass is defined and the remaining 33 points are used to describe the cardiac boundary. The description of the cardiac boundary alleviates the initial finding of the blood masses. The blood masses are then segmented the same way as described for the ventricular blood mass search. More information can be found in [28Pfeifer B, Seger M, Hintermüller C, et al. AAM-based segmentation for imaging cardiac electrophysiology Methods Inf Med 2007; 46: 36-42.].
4.5. Atrial and Ventricular Myocardium Reconstruction
Because of the used MRI settings the myocardium can not be detected by a human expert in the volume data at any location, especially this remains true for the atrial myocardium caused by the imaging modalities (slice thickness 4 mm). Therefore, a-priori information needs to be used in order to reconstruct or estimate the myocardial model using an algorithm. For the myocardial reconstruction, operations of mathematical morphology [29Dougherty ER, Lotufo RA. Hands-on Morphological Image Processing, Volume TT59 SPIE 2003.], especially dilation operations, are employed. The approach is based on circles (structuring element) with a radius range from a minimum to a maximum myocardial thickness. These circles roll around the blood mass boundary and try to detect the myocardial structure by probing all related voxels if they are myocardial voxels or not. If the probed voxel is below a predefined lower value or exceeds an upper value then the algorithm chooses a mean myocardial thickness. This situation occurs predominantly when reconstructing the atrial myocardium, and, therefore, one can speak of ”myocardium estimation”. A precise description of the blood mass extraction and the myocardial reconstruction approach can be found in references [28Pfeifer B, Seger M, Hintermüller C, et al. AAM-based segmentation for imaging cardiac electrophysiology Methods Inf Med 2007; 46: 36-42., 30Pfeifer B, Fischer G, Hanser F, et al. Atrial and ventricular myocardium extraction using model-based techniques Methods Inf Med 2006; 45: 19-26.].
4.6. Volume Conductor Integration
Upon completion of the compartment extraction, these parts need to be coupled together to the patient-specific volume conductor model. The environment chosen to create the patient-specific 3D model is AmiraDev™ 3.0 (TGS Europe Inc.). This environment is a visualization tool, which also allows creating triangular meshes. Furthermore, the functionality of the environment can be expanded by self-developed plug-ins. In our case the complete non-invasive cardiac imaging software packages were developed as AmiraDev™ plug-ins.
The labeled image data are first smoothed to eliminate sharp edges and then triangulated using a standard marching cubes algorithm provided by AmiraDev™. In addition, a remeshing process guaranteeing quality standards (equilaterality of triangles) is performed to qualify for a Boundary Element Method (BEM) needed for solving the inverse problem.
In a next step an in-house developed software package (Amira plug-in) checks if triangles of the triangulated and smoothed compartments have intersections. This quality check is necessary because an intersection of two or more compartments results in numerical errors during activation time estimation. If an intersection is present, the intersecting triangles need to be moved. A basic rule is that the triangles of passive compartments (chest, lungs) should be moved until no intersection occurs. Fig. (2) shows such a triangulated and ready-to-use patient-specific volume conductor model.
4.7. Non-Invasive Imaging of the Cardiac Electrical Function
The body surface potential (BSP) map is acquired in 62 channels by the Mark-8 system (Biosemi V.O.F.). The Wilson-Central-Terminal (WCT) defined the reference potential [31Fischer G, Tilg B, Modre R, Hanser F, Messnarz B, Wach P. On modeling the Wilson terminal in the boundary and finite element method IEEE Trans Biomed Eng 2002; 49(3): 217-4.]. The sampling rate was 2048Hz. Signals were bandpass filtered with a lower and upper edge frequency of 0.3 and 400Hz, respectively. The AC-resolution of the system was 500nVbit-1 (16 bits per channel).
After transformation of the electrode coordinates into the MRI frame, using affine registration provided by the Polhemus Software package, the leadfield matrix L is calculated by employing a BEM formulation. The leadfield matrix represents the relation between the electrical sources in the heart and the electrical potentials in the electrodes placed on the chest of the computer model. The conductivities were chosen according to [32Roth BJ. Electrical conductivity values used with the bidomain model of cardiac tissue IEEE Trans Biomed Eng 1997; 44(4): 326-8.]: myocardium (intra- and extracellular): 0.1 Sm-1; lungs: 0.08 Sm-1; blood masses: 0.6 Sm-1; chest: 0.2 Sm-1. The inverse solution via activation time imaging is computed by minimizing the following cost function:
where the surface Laplacian △ is introduced in (5) in order to avoid unphysiological patterns by smoothing the solutions of the activation time patterns. The parameter λ controlls the amount of regularization. The optimal value of the regularization parameter is computed by using the L-curve-method [33Hansen PC. Rank-deficient and discrete ill-posed problems: numerical aspects of linear inversion. PA USA: Philadelphia 1998. Society for Industrial and Applied Mathematics]. This parameter is necessary to regularize the ill-posed problem cost function given in (5). The matrix D contains the measured (time discrete) ECG data in the electrodes and
5. MODEL ACCURACY
When facing the challenge to solve the ill-posed problem of non-invasive cardiac electrical source imaging many circumstances will influence the result. First of all, the forward problem has a unique solution whereas the inverse problem cannot be solved uniquely. Because of this, the inverse problem depends on any available a-priori information. One also needs to be careful in the representation of the data uncertainties. Furthermore, the ECG signal has to be of high quality, the model error of the volume conductor needs to be as small as possible, and the coupling of the different coordinate systems (MRI coordinate system, global coordinate system of the electrodes, CARTO™) also needs to be done carefully to keep the global model error low, because small changes in the system may affect the result dramatically.
The CARTO™maps created during the EPS by the cardiologist represent the gold standard with regard to electroanatomical function in the target chamber. Therefore, after the interventional treatment all relevant data are compared with the gold standard to assess the quality of the NICE approach [5Modre R, Tilg B, Fischer G, et al. Atrial noninvasive activation mapping of paced rhythm data J Cardiovasc Electrophysiol 2003; 14(7): 712-19., 34Tilg B, Hanser F, Modre R. Clinical ECG mapping and imaging of cardiac electrical excitation J Electrocardiol 2002; 35: 81-7., 35Tilg B, Fischer G, Modre R, Hanser F, Messnarz B, Roithinger FX. Electrocardiographic imaging of atrial and ventricular electrical activation Med Image Anal 2003; 7(3): 391-98.].
In addition to this check, the generated models, using the AAM approach, were compared to an expert segmentation. Due to the fact that there is no gold standard in segmentation, the human experts’ segmentation was assumed to be the gold standard. Therefore, the blood mass models were extracted by a human expert and the AAM approach, and the segmentation results (binary images) were evaluated in reference to their similarity. The binary Dice [36Dice LR. Measures of the amount of ecologic association between species Ecology 1945; 26(3): 297-302.] similarity coefficient was used to compute the similarity between the approaches. The Dice coefficient was calculated for the ventricular and atrial blood mass models, which were created by a human expert, and the ones created by the AAM approach. The mean coefficient for the ventricular and atrial blood mass is 0.8917 and 0.8665, respectively. The Dice binary similarity coefficient is defined as:
where A and B are the image objects, the operator |.| computes the cardinality of a set and ∩ finds the intersection of two sets.
6. RESULTS
The patient-specific volume conductor modeling approach was tested in eight different patients [11Tilg B, Fischer G, Modre R, et al. Model-based imaging of cardiac electrical excitation in humans IEEE Trans Med Imaging 2002; 21(9): 1031-39.]. Fig. (5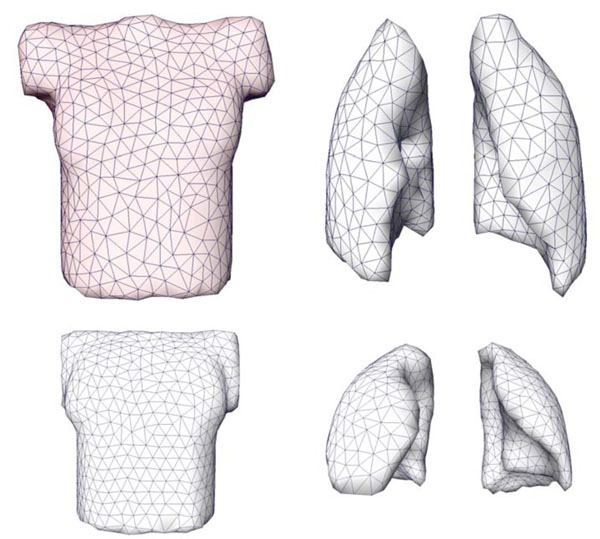 ) shows a triangulated representation of the patient-specific chest and the separated lungs, using an axial scan. The left image (last row) in Fig. (2) shows the chest and the lungs superimposed to the MRI volume data.
 |
Fig. (5) Extracted and triangulated surface meshes of the chest (left) and the separated lungs (right) in an anterior-posterior view. |
The cardiac models were extracted based on a cine-gated short-axis scan. Fig. (6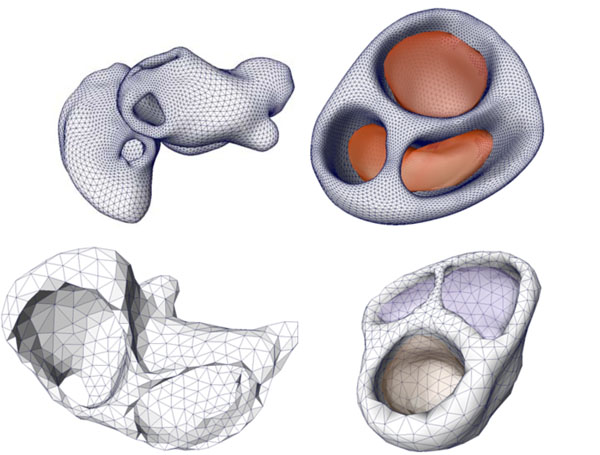 ) shows the triangulated left and right atria and the ventricular model with its blood masses. The right image (last row) in Fig. (2) shows the atria and the ventricles superimposed to the short-axis cine-gated MRI volume data.
 |
Fig. (6) Cardiac models of the coupled left and right atria (left figure) and the ventricular model with the related blood masses (right figure) of two patients. |
These compartments are combined together to the so-called patient-specific volume conductor model that enables the estimation of the electrical excitation in the heart. Fig. (7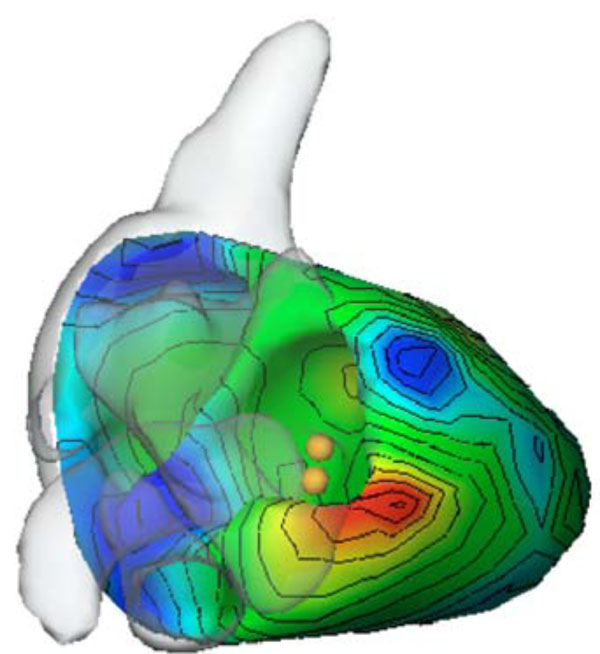 ) illustrates the early activation time map (the early activation time is colored in red; the accessory pathway is located left lateral), computed with our software package.

The positions at which the cardiologist performed the ablation procedure to disconnect the accessory pathway that caused the Wolff Parkinson White (WPW) syndrome is marked by spheres. The difference of the estimated position and the position found by the cardiologist using the CARTO™system is about 1 cm. The reason for this localization difference is mainly due to the above mentioned measurement errors and the fact that the inverse problem solution can only be computed by approximation. One has to keep in mind, however, that the CARTO™system does not provide exact solutions as well.
The overall calculation time for estimating the activation time maps was in the same order of the time necessary for mapping the basal area of the ventricles using CARTO™. The mean segmentation time for a patient-specific model was about 25 min using a Pentium IV with 3.2 GHz clock speed and 1 GB of main memory (RAM). Compared to a manual segmentation procedure the segmentation pipeline enables the non-invasive cardiac imaging process to become clinically applicable. Furthermore, with the activation time imaging approach maps can be computed for both chambers, whereas the conventional CARTO™ system is able to image only one target chamber.
7. CONCLUSION
The goal of this work was to develop a method for constructing a patient-specific volume conductor model in a fast and accurate way in order to estimate the electrical excitation in a human functional heart model for clinical applications. The development of the MST framework allows creating tissue-specific segmentation pipelines due to the clear, homogenous and, thus, easy-to-use interface. The possibility to integrate different frameworks into MST enables to increase functionality without increasing complexity.
The extraction of the ventricular and atrial blood masses yielded the same quality as the ones obtained by human experts. The myocardium extraction or estimation, in case the a-priori information had to be used, proved successful, but with the addition that the complex geometry of the atria with its orifices (especially the pulmonary veins) needed sometimes little manual corrections.
By obtaining the morphological image data using computed tomography (CT) the accuracy of the myocardium could be increased, but the radiation exposure and the use of a contrast agent does not legitimate this procedure. Furthermore, the ill-posed nature of the approach along with the smoothing properties of the Fredholm integral limits the quality of the results anyway.
At this time the VCM is a static one; the ventricular and the atrial model characterize the systole of the heart. Although it is possible to generate a patient-specific cardiac model at different trigger stages using this approach, the calculated time-dependent leadfield matrix L, needed for performing the simulation, would result in an extreme amount of data and computational time - in an exponential order. Theoretically, such a time-dependent leadfield matrix would allow a more precise simulation, the calculation time and the handling of these large data sets would render the problem insolvable for a state-of-the-art workstation.
When performing non-invasive cardiac imaging many different steps have to be combined. For achieving best possible results the whole non-invasive cardiac imaging workflow needs to be processed precisely to keep the mean model error at a low level.
8. SUMMARY
The creation of a semi-automatic volume conductor modeling pipeline enables the NICE approach to be clinically applicable. The effort to create a modeling pipeline that is able to extract the relevant compartments in a short time with high accuracy increased the overall model quality and decreased the user interaction complexity.
Our clinical NICE studies show that this technique is feasible and supports the cardiologist with important information.
ACKNOWLEDGEMENTS
We are very grateful to the Department of Cardiology I and the Department of Radiology I, University Hospital Innsbruck, Austria, for their support with clinical data. This research study was funded by the START Y144 program granted by the Austria Federal Ministry of Education, Science and Culture (bm:bwk) in collaboration with the Austrian Science Fund (FWF).
REFERENCES
| [1] | Gulrajani RM, Geselowitz DB. Models of the electrical activity of the heart and computer simulation of the electrocardiogram Crit Rev Biomed Eng 1988; 16: 1-66. |
| [2] | Johnson CR. Computational and numerical methods for bioelectric field problems Crit Rev Biomed Eng 1997; 25: 1-81. citeseer.ist.psu.edu/johnson97computational.html |
| [3] | Modre R, Tilg B, Fischer G, Wach P. An iterative algorithm for myocardial activation time imaging Comput Methods Programs Biomed 2001; 64: 1-7. |
| [4] | Ramanathan C, Ghanem R, Jia P, Ryu K, Rudy Y. Noninvasive electrocardiographic imaging for cardiac electrophysiology and arrhythmia Nat Med 2004; 10(4): 422-28. |
| [5] | Modre R, Tilg B, Fischer G, et al. Atrial noninvasive activation mapping of paced rhythm data J Cardiovasc Electrophysiol 2003; 14(7): 712-19. |
| [6] | Bradley C, Pullan A, Hunter P. Effects of material properties and geometry on electrocardiographic forward simulations Ann Biomed Eng 2000; 28(7): 721-41. |
| [7] | Metting van Rijn AC, Peper A, Grimbergen CA. High quality recording of bioelectric events. Part 1. Interference reduction, theory and practice Med Biol Eng Comput 1990; 28(5): 389-97. |
| [8] | Metting van Rijn AC, Peper A, Grimbergen CA. High quality recording of bioelectric events.Part 2. Low-noise, low-power multichannel amplifier design Med Biol Eng Comput 1991; 29(4): 433-0. |
| [9] | Greensite F. The mathematical basis for imaging cardiac electrical function Crit Rev Biomed Eng 1994; 22: 347-99. |
| [10] | Modre R, Tilg B, Fischer G, Wach P. A noninvasive Myocardial Activation Time Imaging: A novel Inverse Algorithm applied to Clinical ECG Mapping Data IEEE Trans Biomed Eng 2002; 49(10): 1153-61. |
| [11] | Tilg B, Fischer G, Modre R, et al. Model-based imaging of cardiac electrical excitation in humans IEEE Trans Med Imaging 2002; 21(9): 1031-39. |
| [12] | Haissaguerre M, Jais P, Shah DC, et al. Spontaneous initiation of atrial fibrillation by ectopic beats originating from the pulmonary veins N Engl J Med 1998; 339(10): 659-6. |
| [13] | Vigmond EJ, Ruckdeschel R, Trayanova NA. Reentry in a morphologically realistic atrial model J Cardiovasc Electrophysiol 2001; 12(9): 1046-54. |
| [14] | Morady F. Radio-frequency ablation as treatment for cardiac arrhythmias N Engl J Med 1999; 340(7): 534-44. |
| [15] | Andrea E, Atie J, Maciel W, et al. Mapping of supraventricular tachycardias by using a new tridimensional technology — The CARTO system J Electrocardiol 2001; 34(4): 334. |
| [16] | Pfeifer B, Hanser F, Seger M. A C++ Framework for creating tissue specific segmentation-pipelines In: Galloway Jr RL, Cleary KR, Eds. Medical Imaging 2005: Visualization, Image-Guided Procedures, and Display, Volume 5744 of Proc of SPIE In Medical Imaging 2005: Visualiztion. 2005; pp. 317-28. SPIE - The International Society for Optical Engineering |
| [17] | Adams R, Bischof L. Seeded Region Growing IEEE Trans Pattern Anal Mach Intell 1994; 16(6): 641-47. |
| [18] | Roberts LG. Machine Perception of 3-D Solids In: Optical and Electro-optical Information Processing. MIT press 1965; pp. 159-97. |
| [19] | Kuhnigk JM, Hahn HK, Hindennach M, Dicken V, Krass S, Peitgen HO. Lung lobe segmentation by anatomy-guided 3D watershed transform In: Sonka M, Fitzpatrick JM, Eds. Medical Imaging 2003: Image Processing, Volume 5032 of Proc of SPIE. 2003; pp. 1482-90. SPIE - The International Society for Optical Engineering |
| [20] | Müller H, Marquis S, Cohen G, Lovis C, Geissbuhler A. Lung CT Analysis and Retrieval as a Diagnostic Aid In: Engelbrech R, Geissbuhler A, Lovis C, Mihalas G, Eds. Studies in Health Technology and Informatics, Volume 116 of Proc of MIE2005 - The XIXth International Congress of the European Federation for Medical Informatics. Netherlands: Nieuwe Hemweg 6B 1013 BG Amsterdam. The Netherlands IOS Press 2005; pp. 453-58. |
| [21] | Cootes T, Edwards GJ, Taylor CJ. Active appearance models In: Burkhardt H, Neumann B, Springer Verlag, Eds. Volume 2 In: 5th European Conference on Computer Vision; 1998; pp. : 484-98. |
| [22] | Edwards GJ, Taylor CJ, Cootes TF. Interpreting face images using active appearance models IEEE Pervasive Comput. In: FG '98: Proc. of the 3rd. International Conference on Face & Gesture Recognition; Washington DC USA. 1998; pp. 300-05. |
| [23] | Cootes T, Taylor C. Statistical models of appearance for computer vision Technical report 2004. citeseer.ist.psu.edu/cootes04statistical.html |
| [24] | Lantis A, Taylor CJ, Cootes TF. Automatic tracking, coding and reconstruction of human faces using flexible appearance models IEE Electronic Letters 1994; 30(19): 1588-89. |
| [25] | Cootes T, Taylor C. Modelling object appearance using the grey-level surface In: Hancock E, Ed. In: Proc. of the British Machine Vision Conference; BMVA Press 1994; pp. 479-88. |
| [26] | Stegmann MB, Ersbøll BK, Larsen R. FAME A Flexible Appearance Modelling Environment IEEE Transactions on Medical Imaging 2003; 22(10): 1319-31. http: //www.imm.dtu.dk/pubdb/p.php?. 1918 |
| [27] | Stegmann MB. Active Appearance Models Application Programmers Interface (AAM-API) Documentation http: //www.imm.dtu.dk/ aam/aamapi/[Platform: MS Windows] 2003. |
| [28] | Pfeifer B, Seger M, Hintermüller C, et al. AAM-based segmentation for imaging cardiac electrophysiology Methods Inf Med 2007; 46: 36-42. |
| [29] | Dougherty ER, Lotufo RA. Hands-on Morphological Image Processing, Volume TT59 SPIE 2003. |
| [30] | Pfeifer B, Fischer G, Hanser F, et al. Atrial and ventricular myocardium extraction using model-based techniques Methods Inf Med 2006; 45: 19-26. |
| [31] | Fischer G, Tilg B, Modre R, Hanser F, Messnarz B, Wach P. On modeling the Wilson terminal in the boundary and finite element method IEEE Trans Biomed Eng 2002; 49(3): 217-4. |
| [32] | Roth BJ. Electrical conductivity values used with the bidomain model of cardiac tissue IEEE Trans Biomed Eng 1997; 44(4): 326-8. |
| [33] | Hansen PC. Rank-deficient and discrete ill-posed problems: numerical aspects of linear inversion. PA USA: Philadelphia 1998. Society for Industrial and Applied Mathematics |
| [34] | Tilg B, Hanser F, Modre R. Clinical ECG mapping and imaging of cardiac electrical excitation J Electrocardiol 2002; 35: 81-7. |
| [35] | Tilg B, Fischer G, Modre R, Hanser F, Messnarz B, Roithinger FX. Electrocardiographic imaging of atrial and ventricular electrical activation Med Image Anal 2003; 7(3): 391-98. |
| [36] | Dice LR. Measures of the amount of ecologic association between species Ecology 1945; 26(3): 297-302. |